

Question: Use the following information to answer the questions below: note: all sales are credit sales 2020 Income Stmt info: Sales $ less Cost of Goods
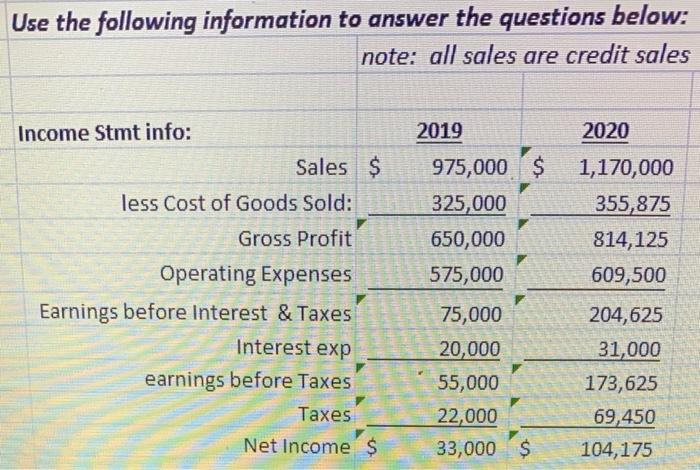
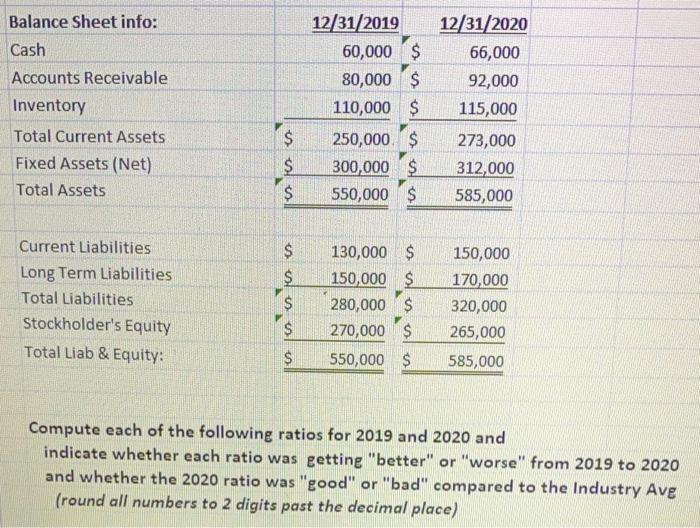
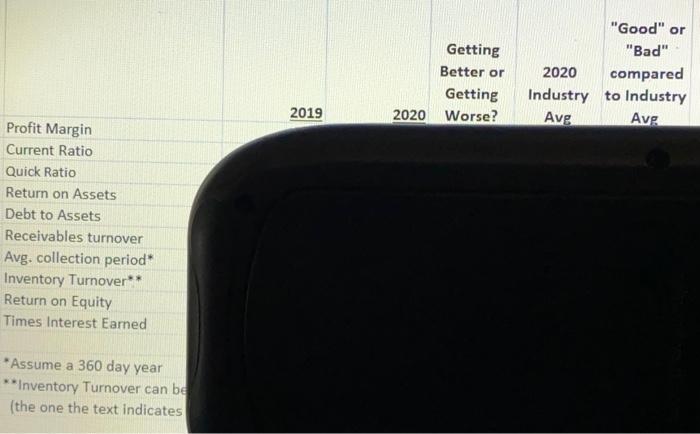
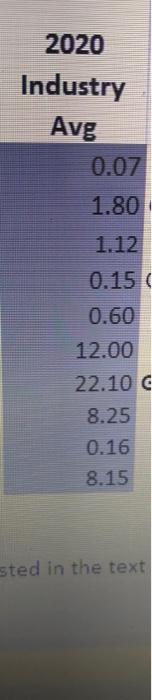
Use the following information to answer the questions below: note: all sales are credit sales 2020 Income Stmt info: Sales $ less Cost of Goods Sold: Gross Profit Operating Expenses Earnings before Interest & Taxes Interest exp earnings before Taxes Taxes Net Income $ 2019 975,000 $ 325,000 650,000 575,000 1,170,000 355,875 814,125 609,500 75,000 20,000 55,000 22,000 33,000 $ 204,625 31,000 173,625 69,450 104,175 Balance Sheet info: Cash Accounts Receivable Inventory Total Current Assets Fixed Assets (Net) Total Assets 12/31/2019 60,000 $ 80,000 $ 110,000 $ 250,000 $ 300,000 $ 550,000 $ 12/31/2020 66,000 92,000 115,000 $ $ $ 273,000 312,000 585,000 Current Liabilities Long Term Liabilities Total Liabilities Stockholder's Equity Total Liab & Equity: $ $ S 130,000 $ 150,000 $ 280,000 $ 270,000 $ 550,000 $ 150,000 170,000 320,000 265,000 $ $ 585,000 Compute each of the following ratios for 2019 and 2020 and indicate whether each ratio was getting "better" or "worse" from 2019 to 2020 and whether the 2020 ratio was "good" or "bad" compared to the Industry Ave (round all numbers to 2 digits past the decimal place) 2020 Industry Avg 0.07 1.80 1.12 0.15 0.60 12.00 22.10 C 8.25 0.16 8.15 sted in the text
Step by Step Solution
There are 3 Steps involved in it

Get step-by-step solutions from verified subject matter experts