

Question: Use the Google Sheets to plot the given data to answer this question. What is the slope of the linear line fit for the
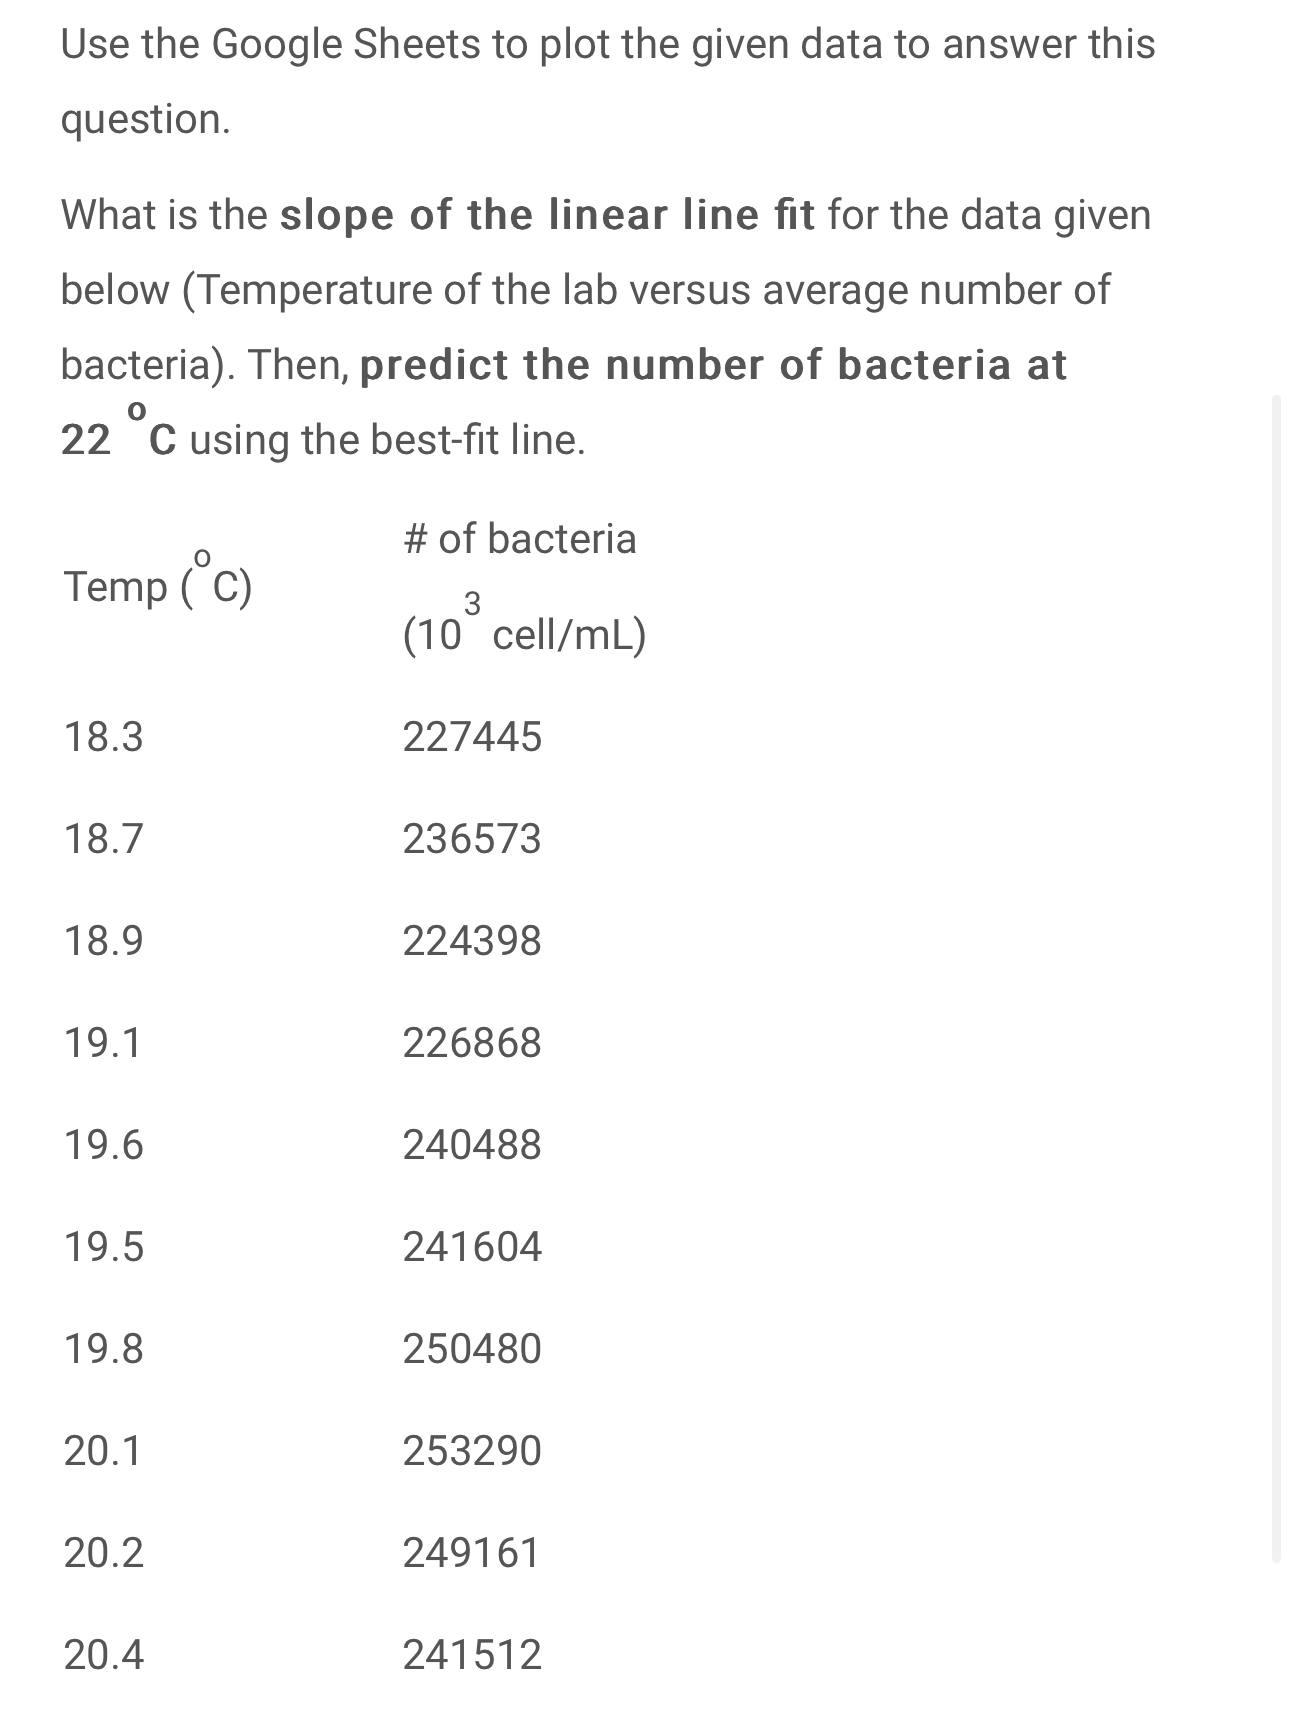
Use the Google Sheets to plot the given data to answer this question. What is the slope of the linear line fit for the data given below (Temperature of the lab versus average number of bacteria). Then, predict the number of bacteria at 22 C using the best-fit line. # of bacteria Temp (C) 3 (10 cell/mL) 18.3 227445 18.7 236573 18.9 224398 19.1 226868 19.6 240488 19.5 241604 19.8 250480 20.1 253290 20.2 249161 20.4 241512
Step by Step Solution
There are 3 Steps involved in it
1 Expert Approved Answer
Step: 1 Unlock

Question Has Been Solved by an Expert!
Get step-by-step solutions from verified subject matter experts
Step: 2 Unlock
Step: 3 Unlock