

Question: Use the graph below (Figure 1) to answer question Figure 1: Use Figure 1 below to answer the question. The indifference curves 1-4 have the
Use the graph below (Figure 1) to answer question
Figure 1:
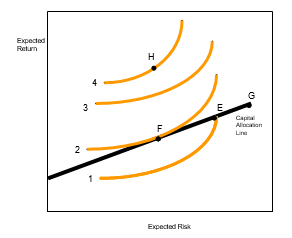
Use Figure 1 below to answer the question.
The indifference curves 1-4 have the same risk aversion coefficient (A). Answer the following:
Rank the indifference curves in order of highest to lowest Utility.
Which curve represents the greatest utility achievable by the investor?
Which point represents the optimal complete portfolio?
Expected Risk
Step by Step Solution
There are 3 Steps involved in it
1 Expert Approved Answer
Step: 1 Unlock

Question Has Been Solved by an Expert!
Get step-by-step solutions from verified subject matter experts
Step: 2 Unlock
Step: 3 Unlock