

Question: use the graph below (i) Question 1 Use the graph below to explain the output, profit and loss conditions for monopolistically competitive firms. Show your
use the graph below
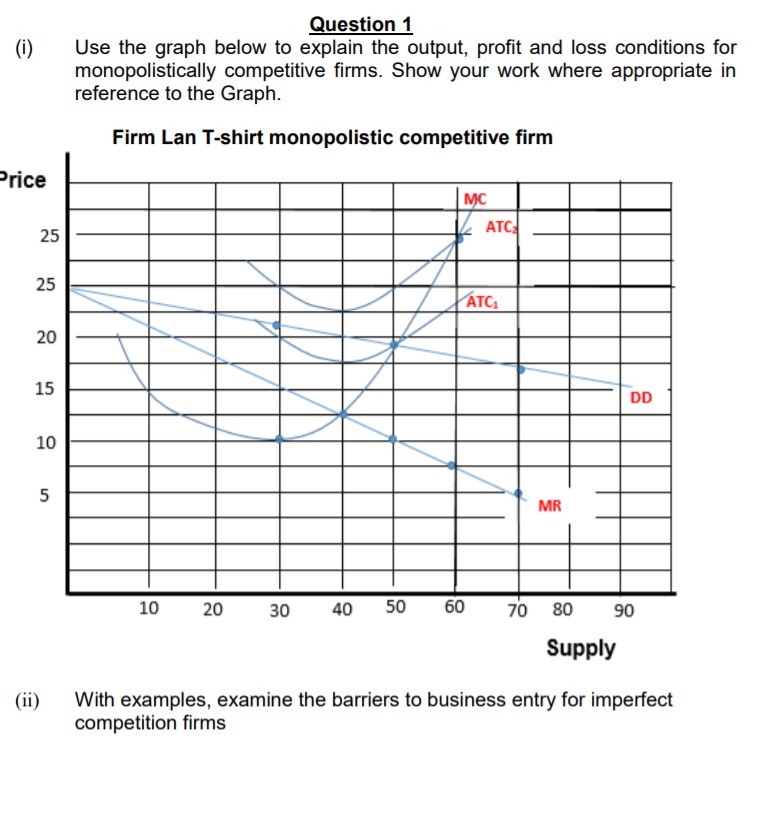
(i) Question 1 Use the graph below to explain the output, profit and loss conditions for monopolistically competitive firms. Show your work where appropriate in reference to the Graph. Firm Lan T-shirt monopolistic competitive firm Price MC 25 ATC 25 ATCI 20 15 DD 10 5 MR 10 20 30 40 50 60 70 80 90 Supply (ii) With examples, examine the barriers to business entry for imperfect competition firms
Step by Step Solution
There are 3 Steps involved in it
1 Expert Approved Answer
Step: 1 Unlock

Question Has Been Solved by an Expert!
Get step-by-step solutions from verified subject matter experts
Step: 2 Unlock
Step: 3 Unlock