

Question: Use the graph below to answer the next 3 questions. The following graph of the federal funds market describes the demand curve for reserves prior
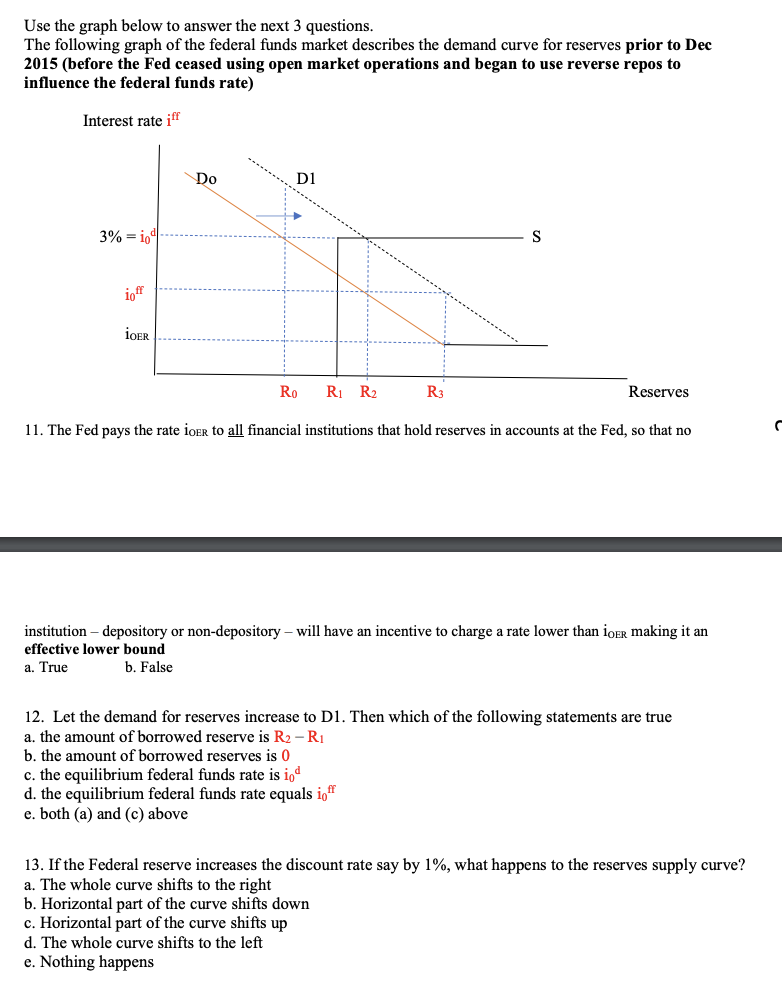
Use the graph below to answer the next 3 questions. The following graph of the federal funds market describes the demand curve for reserves prior to Dec 2015 (before the Fed ceased using open market operations and began to use reverse repos to influence the federal funds rate) Interest rate if Do D1 3% = 10 S ioff LOER Ro R1 R2 R3 Reserves 11. The Fed pays the rate loer to all financial institutions that hold reserves in accounts at the Fed, so that no institution - depository or non-depository - will have an incentive to charge a rate lower than loer making it an effective lower bound a. True b. False 12. Let the demand for reserves increase to D1. Then which of the following statements are true a. the amount of borrowed reserve is R2 -Ri b. the amount of borrowed reserves is 0 c. the equilibrium federal funds rate is in d. the equilibrium federal funds rate equals i,ff e. both (a) and (c) above 13. If the Federal reserve increases the discount rate say by 1%, what happens to the reserves supply curve? a. The whole curve shifts to the right b. Horizontal part of the curve shifts down c. Horizontal part of the curve shifts up d. The whole curve shifts to the left e. Nothing happens
Step by Step Solution
There are 3 Steps involved in it

Get step-by-step solutions from verified subject matter experts