

Question: Tom made a series RLC circuit as shown in Figure 5. Then he connected the circuit to a signal generator and applied a 5
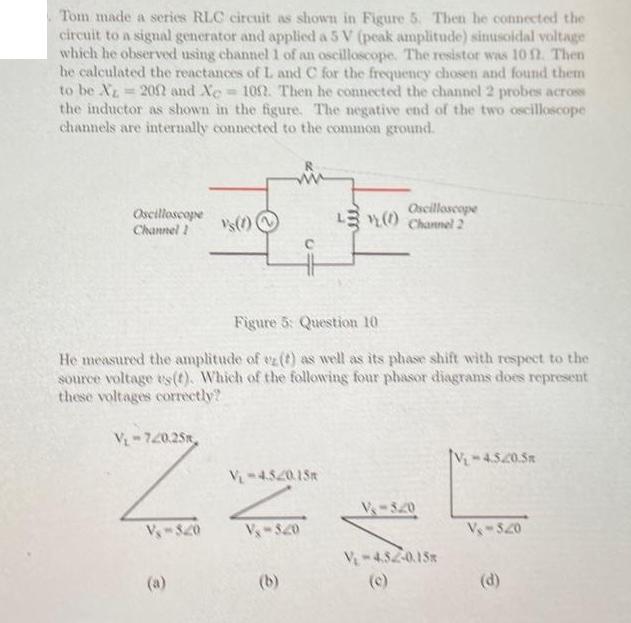
Tom made a series RLC circuit as shown in Figure 5. Then he connected the circuit to a signal generator and applied a 5 V (peak amplitude) sinusoidal voltage which he observed using channel 1 of an oscilloscope. The resistor was 10 f2. Then he calculated the reactances of L and C for the frequency chosen and found them to be Xz 2002 and Xe 100. Then he connected the channel 2 probes across the inductor as shown in the figure. The negative end of the two oscilloscope channels are internally connected to the common ground. Oscilloscope Channel 1 vs (1) ~ Figure 5: Question 10 He measured the amplitude of ez (t) as well as its phase shift with respect to the source voltage vs(t). Which of the following four phasor diagrams does represent these voltages correctly? V-720.25, 22 V-320 V-320 (b) 3 Oscilloscope LY Channel 2 V-4.520.18m V-4.52-0.15m V-4.520.5 V-520 (d)
Step by Step Solution
3.37 Rating (153 Votes )
There are 3 Steps involved in it
The detailed answer for the above question is provided below To select the correct phasor diagram for the given RLC circuit we need to consider the ph... View full answer

Get step-by-step solutions from verified subject matter experts