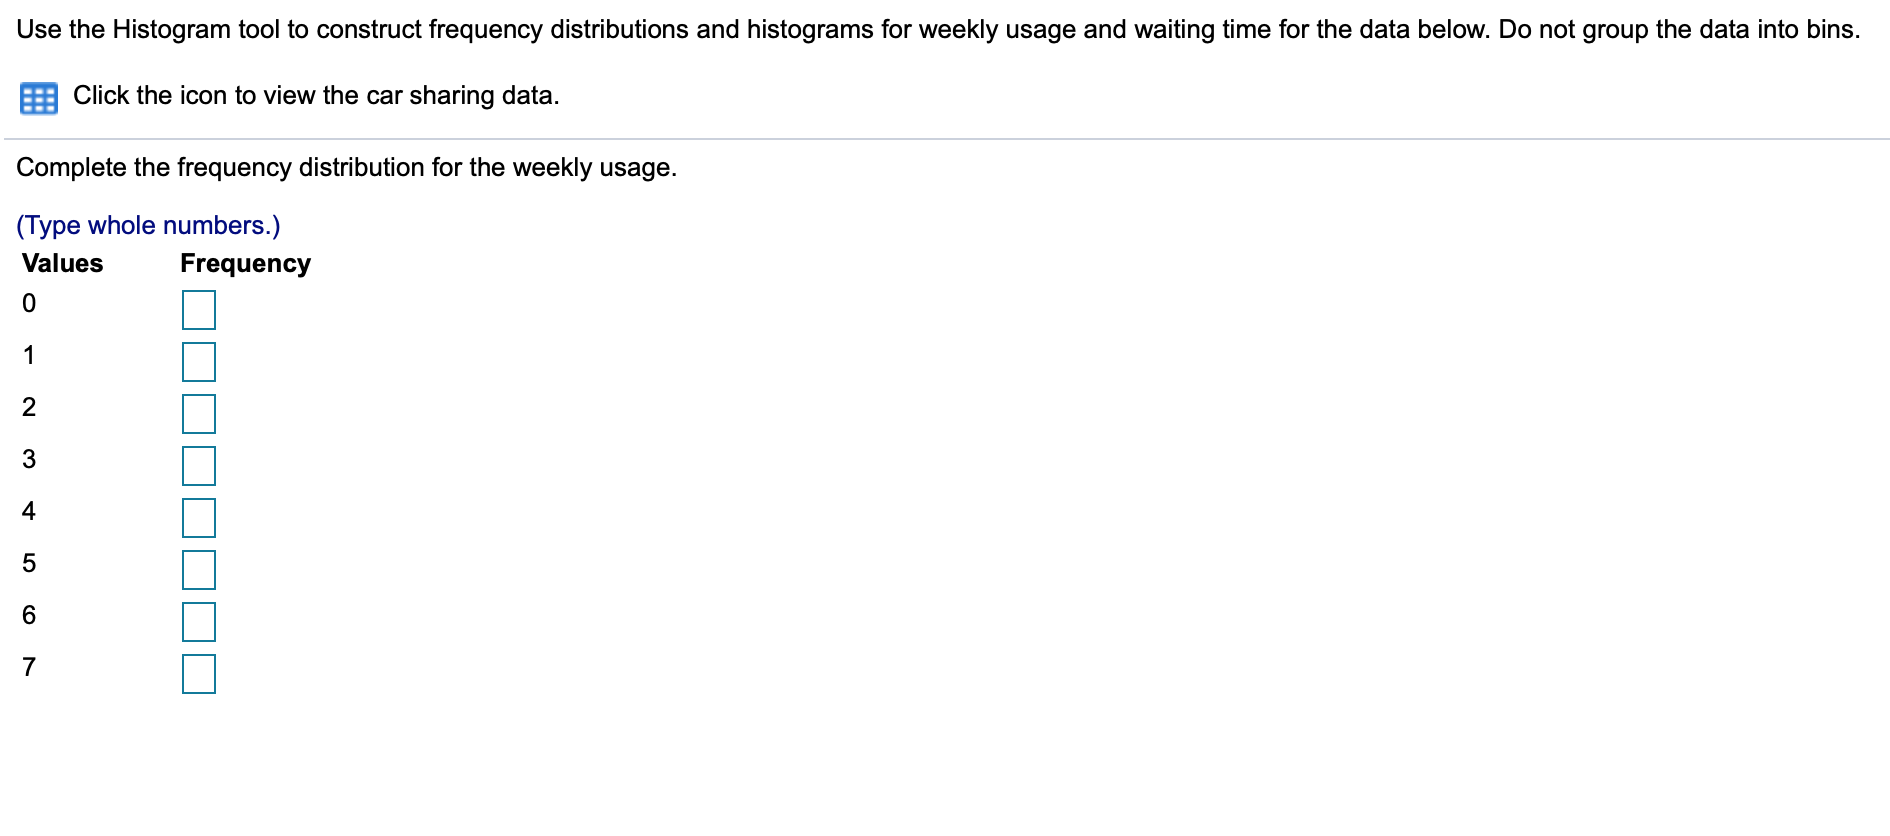
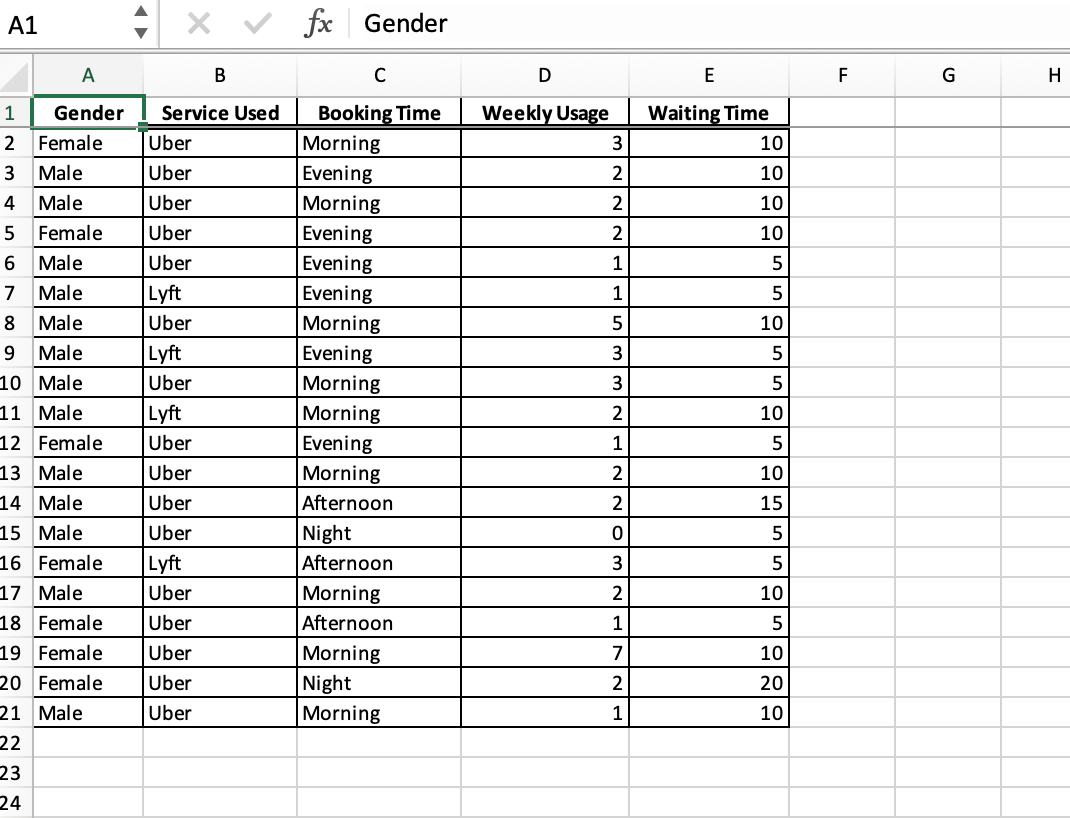
Question: Use the Histogram tool to construct frequency distributions and histograms for weekly usage and waiting time for the data below. Do not group the data

Use the Histogram tool to construct frequencyUse the Histogram tool to construct frequency

Use the Histogram tool to construct frequency distributions and histograms for weekly usage and waiting time for the data below. Do not group the data into bins. Click the icon to view the car sharing data. Complete the frequency distribution for the weekly usage. (Type whole numbers.) Values Frequency 0 1 2 3 4 5 6 7 A1 fx Gender A B D E F G H Weekly Usage 3 Waiting Time 10 2 10 2 10 2 10 1 5 1 5 5 10 3 5 3 5 1 Gender 2 Female 3 Male 4 Male 5 Female 6 Male 7 Male 8 Male 9 Male 10 Male 11 Male 12 Female 13 Male 14 Male 15 Male 16 Female 17 Male 18 Female 19 Female 20 Female 21 Male Service Used Uber Uber Uber Uber Uber Lyft Uber Lyft Uber Lyft Uber Uber Uber Uber Lyft Uber Uber Uber Uber Uber Booking Time Morning Evening Morning Evening Evening Evening Morning Evening Morning Morning Evening Morning Afternoon Night Afternoon Morning Afternoon Morning Night Morning 2 10 1 5 2 10 2 15 0 5 3 5 2 10 1 5 7 10 20 2 1 10 22 23 24

Step by Step Solution

There are 3 Steps involved in it

1 Expert Approved Answer
Step: 1 Unlock blur-text-image
Question Has Been Solved by an Expert!

Get step-by-step solutions from verified subject matter experts

Step: 2 Unlock
Step: 3 Unlock

Students Have Also Explored These Related General Management Questions!