

Question: Use the information provided in the Table 1 and the network diagram in Figure 1 for the following problems. Crash Time Crash Cost Maximum
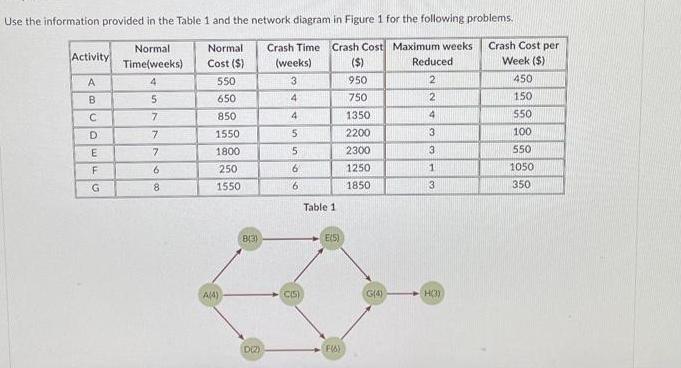

Use the information provided in the Table 1 and the network diagram in Figure 1 for the following problems. Crash Time Crash Cost Maximum weeks (weeks) ($) 950 3 4 750 1350 2200 2300 Activity A B C D E F G Normal Time(weeks) 4 5 7 7 7 6 8 Normal Cost ($) 550 650 850 1550 1800 250 1550 A(4) 813) D(2) 4 5 5 6 6 CIS) Table 1 E(S) F(A) 1250 1850 G(4) Reduced 2 2 4 3 3 1 3 H() Crash Cost per Week ($) 450 150 550 100 550 1050 350 1. Using the information given, Figure 1. AON network diagram Calculate the completion time of the project. Identify the activities on the critical path. 2. Using the information given and the project completion time calculated in Problem 1, reduce the completion time of the project 3 weeks in the most economical way. 3. Using the information given and the project completion time calculated in Problem 1, calculate the minimum time for completing the project possible.
Step by Step Solution
3.36 Rating (159 Votes )
There are 3 Steps involved in it

Get step-by-step solutions from verified subject matter experts