

Question: Use the NPV method to determine whether McKnight Products should invest in the following projects: Project A: Costs $260,000 and offers seven annual net cash
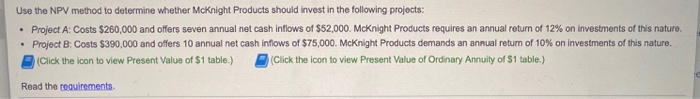
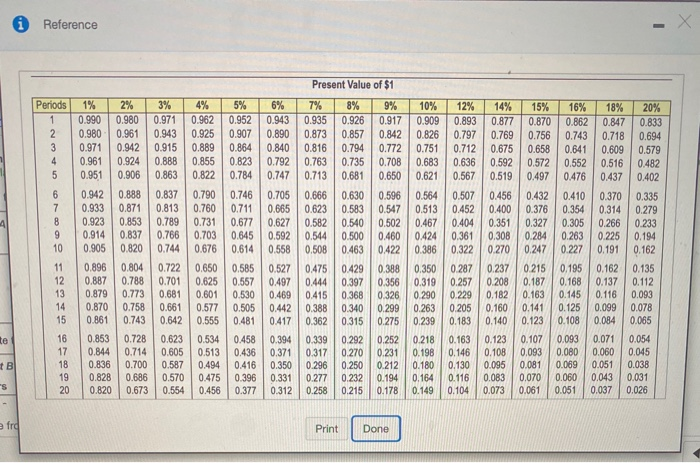
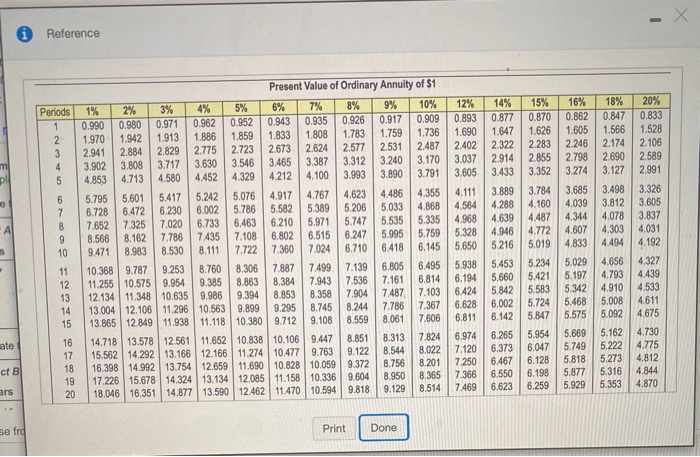
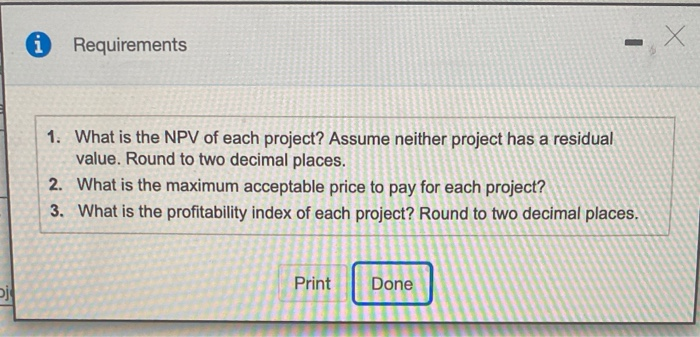
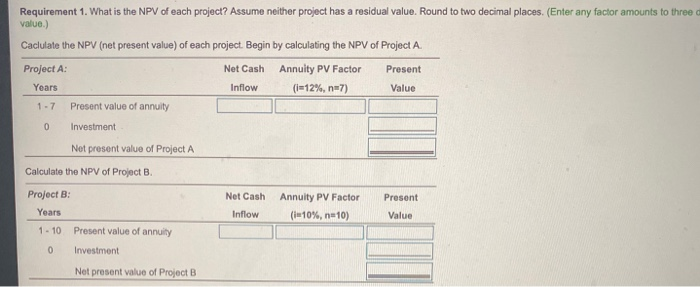
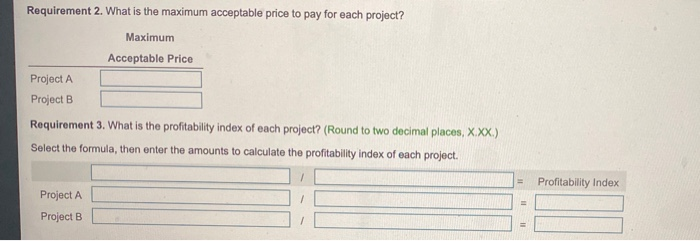
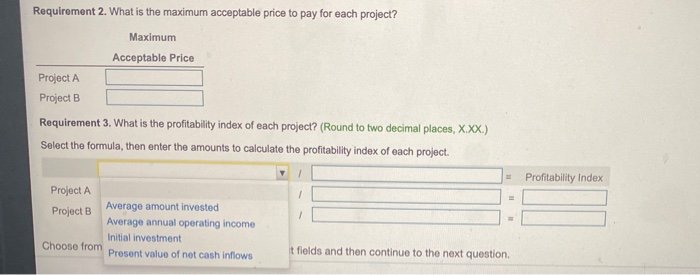
Use the NPV method to determine whether McKnight Products should invest in the following projects: Project A: Costs $260,000 and offers seven annual net cash inflows of $52,000. McKnight Products requires an annual retum of 12% on investments of this nature. Project B: Costs $390,000 and offers 10 annual net cash inflows of $75,000. Mcknight Products demands an annual return of 10% on investments of this nature, (Click the icon to view Present Value of $1 table.) (Click the icon to view Present Value of Ordinary Annuity of $1 table.) Read the requirements Reference Present Value of $1 Periods 1 2 3 4 5 3% 0.971 0.943 0.915 0.8BB 0.863 4% 0.962 0.925 0.889 0.855 0.822 5% 6% 0.952 0.943 0.907 0.890 0.864 0.840 0.8230.792 0.784 0.747 7% 0.935 0.873 0.816 0.763 0.713 8% 0.926 0.857 0.794 0.735 0.681 9% 0.917 0.842 0.772 0.708 0.650 10% 12% 0.909 0.893 0.826 0.797 0.751 0.712 0.683 0.636 0.621 0.567 14% 0.877 0.769 0.675 0.592 0.519 15% 0.870 0.756 0.658 0.572 0.497 16% 18% 0.862 0.847 0.743 0.718 0.641 0.609 0.552 0.516 0.476 0.437 0.410 0.370 0.354 0.314 0.305 0.266 0.263 0.225 0.227 0.191 20% 0.833 0.694 0.579 0.482 0.402 0.335 0.279 0.233 0.194 6 1% 2% 0.990 0.980 0.980 0.961 0.971 0.942 0.961 0.924 0.951 0.906 0.942 0.888 0.933 0.871 0.923 0.853 0.914 0.837 0.905 0.820 0.896 0.804 0.887 0.788 0.879 0.773 0.870 0.758 0.861 0.743 0.853 0.728 0.844 0.714 0.836 0.700 0.828 0.686 0.820 0.673 0.837 0.813 0.789 0.766 0.744 0.790 0.760 0.731 0.703 0.676 0.746 0.711 0.677 0.645 0.614 0.705 0.665 0.627 0.592 0.558 0.666 0.623 0.582 0.544 0.456 0.432 0.400 0.376 0.351 0.327 0.308 0.284 0.270 0.247 10 0.508 0.162 0.630 0.583 0.540 0.500 0.463 0.429 0.397 0.368 0.340 0.315 11 12 13 14 15 0.585 0.557 0.530 0.505 0.481 0.527 0.497 0.469 0.442 0.417 0.475 0.444 0.415 0.388 0.362 0.237 0.208 0.182 0.160 0.140 0.596 0.564 0.507 0.547 0.513 0.452 0.502 0.467 0.404 0.460 0.424 0.361 0.422 0.386 0.322 0.388 0.350 0.287 0.356 0.319 0.257 0.326 0.290 0.229 0.299 0.263 0.205 0.275 0.239 0.183 0.252 0.218 0.163 0.231 0.198 0.146 0.212 0.180 0.130 0.194 0.164 0.116 0.178 0.104 0.215 0.187 0.163 0.141 0.123 0.195 0.168 0.145 0.125 0.108 0.162 0.137 0.116 0.099 0.084 0.722 0.701 0.681 0.661 0.642 0.623 0.605 0.587 0.570 0.554 0.135 0.112 0.093 0.078 0.065 0.650 0.625 0.601 0.577 0.555 0.534 0.513 0.494 0.475 0.456 te t B 16 17 18 19 20 0.458 0.436 0.416 0.396 0.377 0.394 0.371 0.350 0.331 0.312 0.339 0.317 0.296 0.277 0.258 0.292 0.270 0.250 0.232 0.215 0.123 0.108 0.095 0.083 0.073 0.107 0.093 0.081 0.070 0.061 0.093 0.080 0.089 0.060 0.051 0.071 0.060 0.051 0.043 0.037 0.054 0.045 0.038 0.031 0.026 -s 0.149 fra Print Done Reference Periods 1 2 3 4 5 14% 0.877 1.647 2.322 2.914 3.433 12% 0.893 1.690 2.402 3.037 3.605 4.111 4.564 4.968 5.328 5.650 15% 0.870 1.626 2283 2.855 3.352 m pl 6 7 8 Present Value of Ordinary Annuity of $1 1% 2% 3% 4% 5% 6% 7% 8% 9% 10% 0.990 0.980 0.971 0.962 0.952 0.943 0.935 0.926 0.917 0.909 1.970 1.942 1.913 1.886 1.859 1.833 1.808 1.783 1.759 1.736 2.941 2.884 2.829 2.775 2.723 2.673 2.624 2.577 2.531 2.487 3.902 3.808 3.717 3.630 3.546 3.465 3.387 3.312 3.240 3.170 4.853 4.713 4.580 4.452 4.329 4.212 4.100 3.993 3.890 3.791 5.795 5.601 5.417 5.242 5.076 4.917 4.767 4.6234.486 4.355 6.728 6.472 6.230 6.002 5.786 5.582 5.389 5.206 5,033 4.868 7.652 7.325 7.020 6.733 6.463 6.210 5.971 5.747 5.535 5.335 8.566 8.162 7.786 7.435 7.108 6.802 6.515 6.247 5.995 5.759 9.471 8.983 8.111 7.722 7.360 7.024 6.710 6.418 6.145 10.3689.787 9.253 8.760 8.306 7.887 7.499 7.139 6.805 6.495 11.255 10.575 9.954 9.385 8.863 8.384 7.943 7.536 7.161 6.814 12.134 11.348 10.635 9.986 9.394 8.853 8.358 7.904 7.487 7.103 13.004 12.106 11.296 10.563 9.899 9.295 8.745 8.244 7.786 7.367 13.865 12.849 11.938 11.118 10.380 9.712 9.108 8.559 8.061 7.606 14.718 13.578 12.561 11.652 10.838 10.1069.447 8.851 8.313 7.824 15,562 14.292 13.166 12.166 11.274 10.477 9.763 9.122 8.022 16.398 14.992 13.754 12.659 11.690 10.828 10.059 9.372 8.756 8.201 17.226 15.678 14.324 13.134 12.085 11.158 10.336 9.604 8.950 8.365 18.046 16.351 14.877 13.590 12.462 11.470 10.5949.818 9.129 8.514 3.889 4.288 4.639 4.946 5.216 9 16% 18% 20% 0.862 0.847 0.833 1.605 1.566 1.528 2.246 2.174 2.106 2.798 2.690 2.589 3274 3.127 2.991 3.685 3.498 3.326 4.039 3.812 3.605 4.344 4.078 3.837 4.607 4.303 4.031 4,833 4.494 4.192 5.029 4.656 4.327 5.197 4.793 4.439 5.342 4.910 4.533 5.468 5.008 4.611 5.575 5.092 4.675 5.669 5.162 4.730 5.749 5.222 4.775 5.818 5.273 4.812 5.877 5.316 4.844 5.929 5.353 4.870 10 3.784 4.160 4.487 4.772 5.019 5.234 5.421 5,583 5.724 5.847 8.530 11 12 13 14 15 5.938 6.194 6.424 6.628 6.811 5.453 5.660 5.842 6.002 6.142 ate 8.544 6.974 7.120 7.250 7.366 7.469 16 17 18 19 20 6.265 6.373 6.467 6.550 6.623 5.954 6.047 6.128 6.198 6.259 ct B ars se fra Print Done i Requirements -X 1. What is the NPV of each project? Assume neither project has a residual value. Round to two decimal places. 2. What is the maximum acceptable price to pay for each project? 3. What is the profitability index of each project? Round to two decimal places. Print Done Requirement 1. What is the NPV of each project? Assume neither project has a residual value. Round to two decimal places. (Enter any factor amounts to three value.) Caciulate the NPV (net present value) of each project. Begin by calculating the NPV of Project A. Project A: Net Cash Annuity PV Factor (i=12%, n7) Value Present value of annuity Present Years Inflow 1-7 0 Investment Net present value of Project A Calculate the NPV of Project B. Project B: Years 1 - 10 Present value of annuity 0 Investment Net Cash Present Annuity PV Factor (-10%, n=10) Inflow Value Net present value of Project B Requirement 2. What is the maximum acceptable price to pay for each project? Maximum Acceptable Price Project A Project B Requirement 3. What is the profitability index of each project? (Round to two decimal places, X.XX.) Select the formula, then enter the amounts to calculate the profitability index of each project. Profitability Index Project A Project B Requirement 2. What is the maximum acceptable price to pay for each project? Maximum Acceptable Price Project A Project B Requirement 3. What is the profitability index of each project? (Round to two decimal places, X.XX.) Select the formula, then enter the amounts to calculate the profitability index of each project. Profitability Index Project A Project B Average amount invested Average annual operating income Initial investment Prosent value of net cash inflows Choose from t fields and then continue to the next
Step by Step Solution
There are 3 Steps involved in it

Get step-by-step solutions from verified subject matter experts