

Question: Use the plot below for questions 1 and 2. 10 20 30 40 50 60 70 80 90 100 110 120 1. The plot above


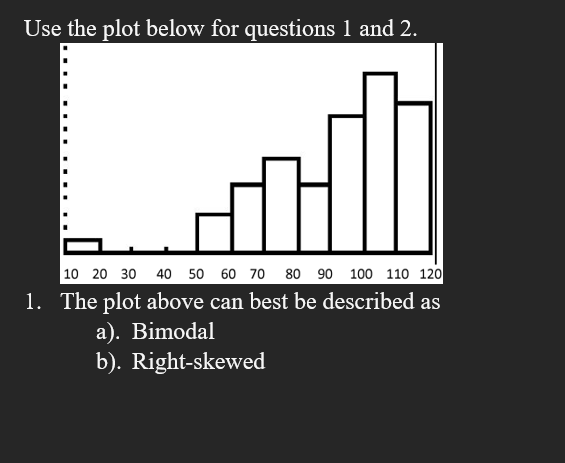
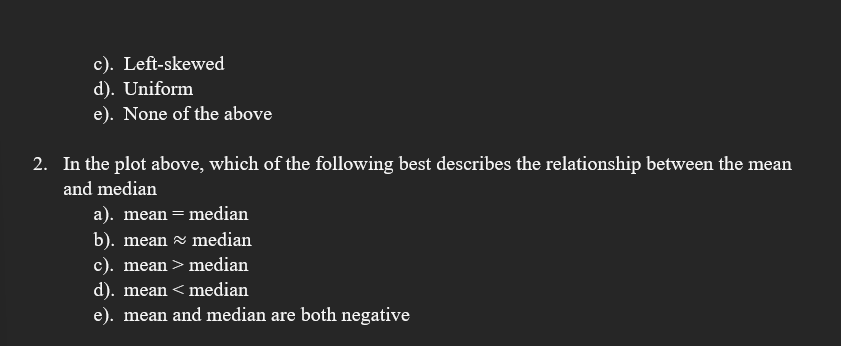
Use the plot below for questions 1 and 2. 10 20 30 40 50 60 70 80 90 100 110 120 1. The plot above can best be described as a). Bimodal b). Right-skewedc). Left-skewed d). Uniform e). None of the above 2. In the plot above, which of the following best describes the relationship between the mean and median a). mean = median b). mean ~ median c). mean > median d). mean
Step by Step Solution
There are 3 Steps involved in it
1 Expert Approved Answer
Step: 1 Unlock

Question Has Been Solved by an Expert!
Get step-by-step solutions from verified subject matter experts
Step: 2 Unlock
Step: 3 Unlock