

Question: : Use the sample data below to test the hypotheses $H_{0}: p_{1}=p_{2}=p_{3}$ $H_{mathrm{a}}$ : Not all population proportions are the same Populations $begin{array}{lccc}text { Response
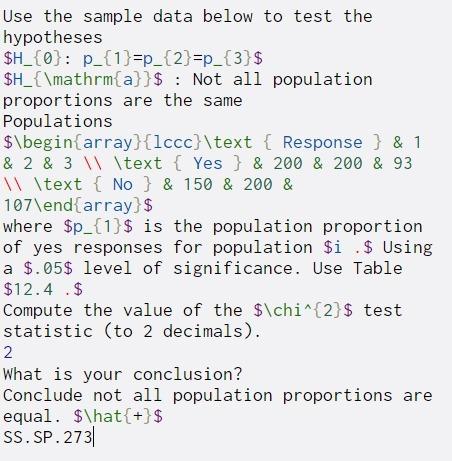
: Use the sample data below to test the hypotheses $H_{0}: p_{1}=p_{2}=p_{3}$ $H_{\mathrm{a}}$ : Not all population proportions are the same Populations $\begin{array}{lccc}\text { Response } & 1 & 2 & 3 \text { Yes } & 200 & 200 & 93 \text { No } & 150 & 200 & 107\end{array}$ where $p_{1}$ is the population proportion of yes responses for population $i .$ Using a $.05$ level of significance. Use Table $12.4 .$ Compute the value of the $\chi^{2}$ test statistic (to 2 decimals). 2 What is your conclusion? Conclude not all population proportions are equal. $\hat{+}$ SS.SP. 273 +
Step by Step Solution
There are 3 Steps involved in it
1 Expert Approved Answer
Step: 1 Unlock

Question Has Been Solved by an Expert!
Get step-by-step solutions from verified subject matter experts
Step: 2 Unlock
Step: 3 Unlock