

Question: Use the sample data below to test the hypotheses Ho: p1 = P2 -P3 Ha : Not all population proportions are the same Populations Response

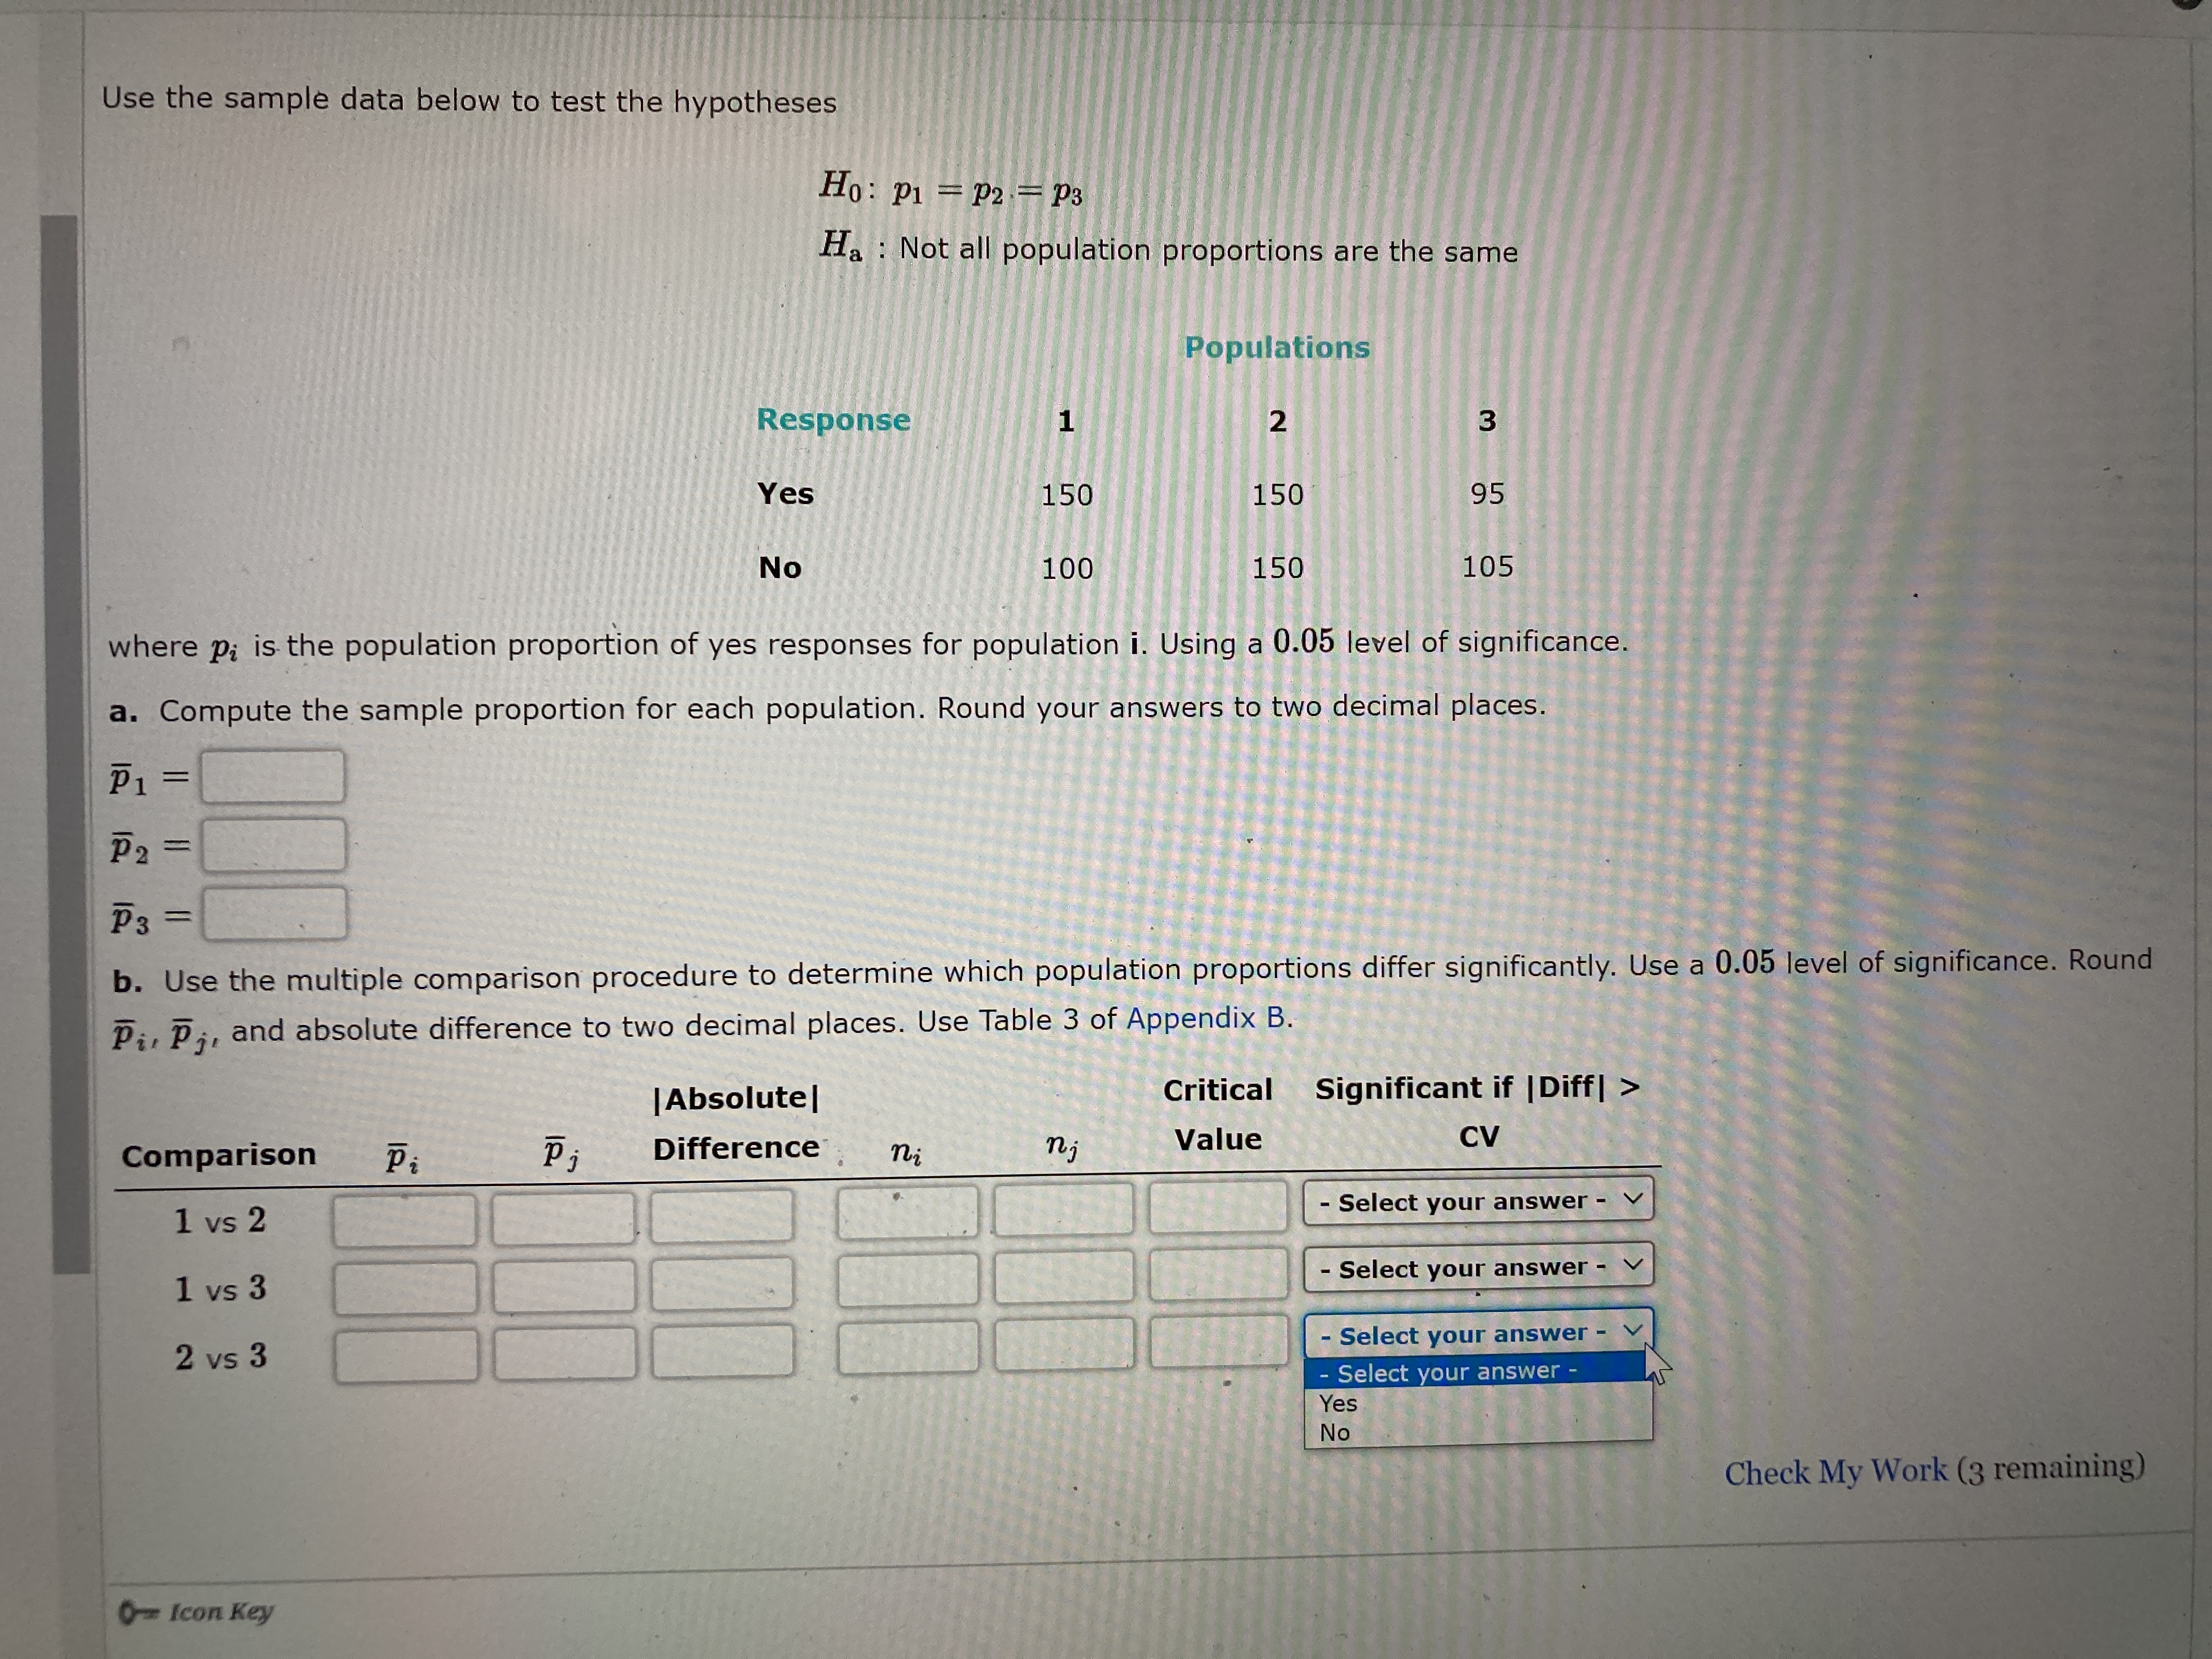
Use the sample data below to test the hypotheses Ho: p1 = P2 -P3 Ha : Not all population proportions are the same Populations Response 1 2 3 Yes 150 150 95 No 100 150 105 where pi is the population proportion of yes responses for population i. Using a 0.05 level of significance a. Compute the sample proportion for each population. Round your answers to two decimal places. P1 = P 2 P3 = b. Use the multiple comparison procedure to determine which population proportions differ significantly. Use a 0.05 level of significance. Round Pur Pj, and absolute difference to two decimal places. Use Table 3 of Appendix B. | Absolute | Critical Significant if | Diff| > Comparison Pi Pi Difference ni nj Value CV 1 vs 2 - Select your answer - 1 vs 3 Select your answer - 2 vs 3 - Select your answer - - Select your answer Yes No Check My Work (3 remaining) Om Icon Key
Step by Step Solution
There are 3 Steps involved in it

Get step-by-step solutions from verified subject matter experts