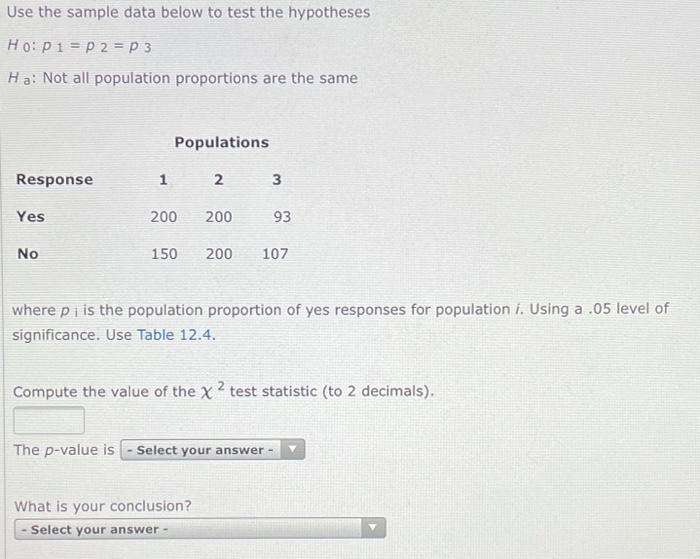
Question: Use the sample data below to test the hypotheses Ho: p1 = p 2 = p 3 Ha: Not all population proportions are the same

Use the sample data below to test the hypotheses
Use the sample data below to test the hypotheses Ho: p1 = p 2 = p 3 Ha: Not all population proportions are the same Populations Response 1 2 3 Yes 200 200 93 No 150 200 107 where p i is the population proportion of yes responses for population i. Using a .05 level of significance. Use Table 12.4. Compute the value of the x 2 test statistic (to 2 decimals), The p-value is Select your answer - What is your conclusion? - Select your answer - Area in Upper Tail Degrees of Freedom .05 -m+ .005 7.879 10.597 12.838 14.860 16.750 4 5 6 7 8 9 10 11 12 13 14 15 .10 2.706 4.605 6.251 7.779 9.236 10.645 12.017 13.362 14.684 15.987 17.275 18.549 19.812 21.064 22.307 3.841 5.991 7.815 9.488 11.070 12.592 14.067 15.507 16.919 18.307 19.675 21.026 22.362 23.685 24.996 .025 5.024 7.378 9.348 11.143 12.832 14.449 16.013 17.535 19.023 20.483 21.920 23.337 24.736 26.119 27.488 .01 6.635 9.210 11.345 13.277 15.086 16.812 18.475 20.090 21.666 23.209 24.725 26.217 27.688 29.141 30.578 18.548 20.278 21.955 23.589 25.188 26.757 28.300 29.819 31.319 32.801

Step by Step Solution

There are 3 Steps involved in it

1 Expert Approved Answer
Step: 1 Unlock blur-text-image
Question Has Been Solved by an Expert!

Get step-by-step solutions from verified subject matter experts

Step: 2 Unlock
Step: 3 Unlock

Students Have Also Explored These Related General Management Questions!