

Question: Use the shared results from the Student Data Table to complete the following problems. Make sure to show all work/calculations. Calculate the Pearson correlation between
Use the shared results from the Student Data Table to complete the following problems. Make sure to show all work/calculations.
- Calculate the Pearson correlation between hand and foot size for members of this STA-201 class. Graph the relationship, determine a hypothesis to test this relationship, and statistically test this hypothesis using alpha=0.05. Interpret all results in a paragraph citing the appropriate statistics.
- Calculate the simple linear regression to determine if the amount of time spent on homework can be predicted by amount of sleep. Graph the relationship and determine, numerically, if there are any outliers. Interpret all results in a paragraph citing the appropriate statistics.
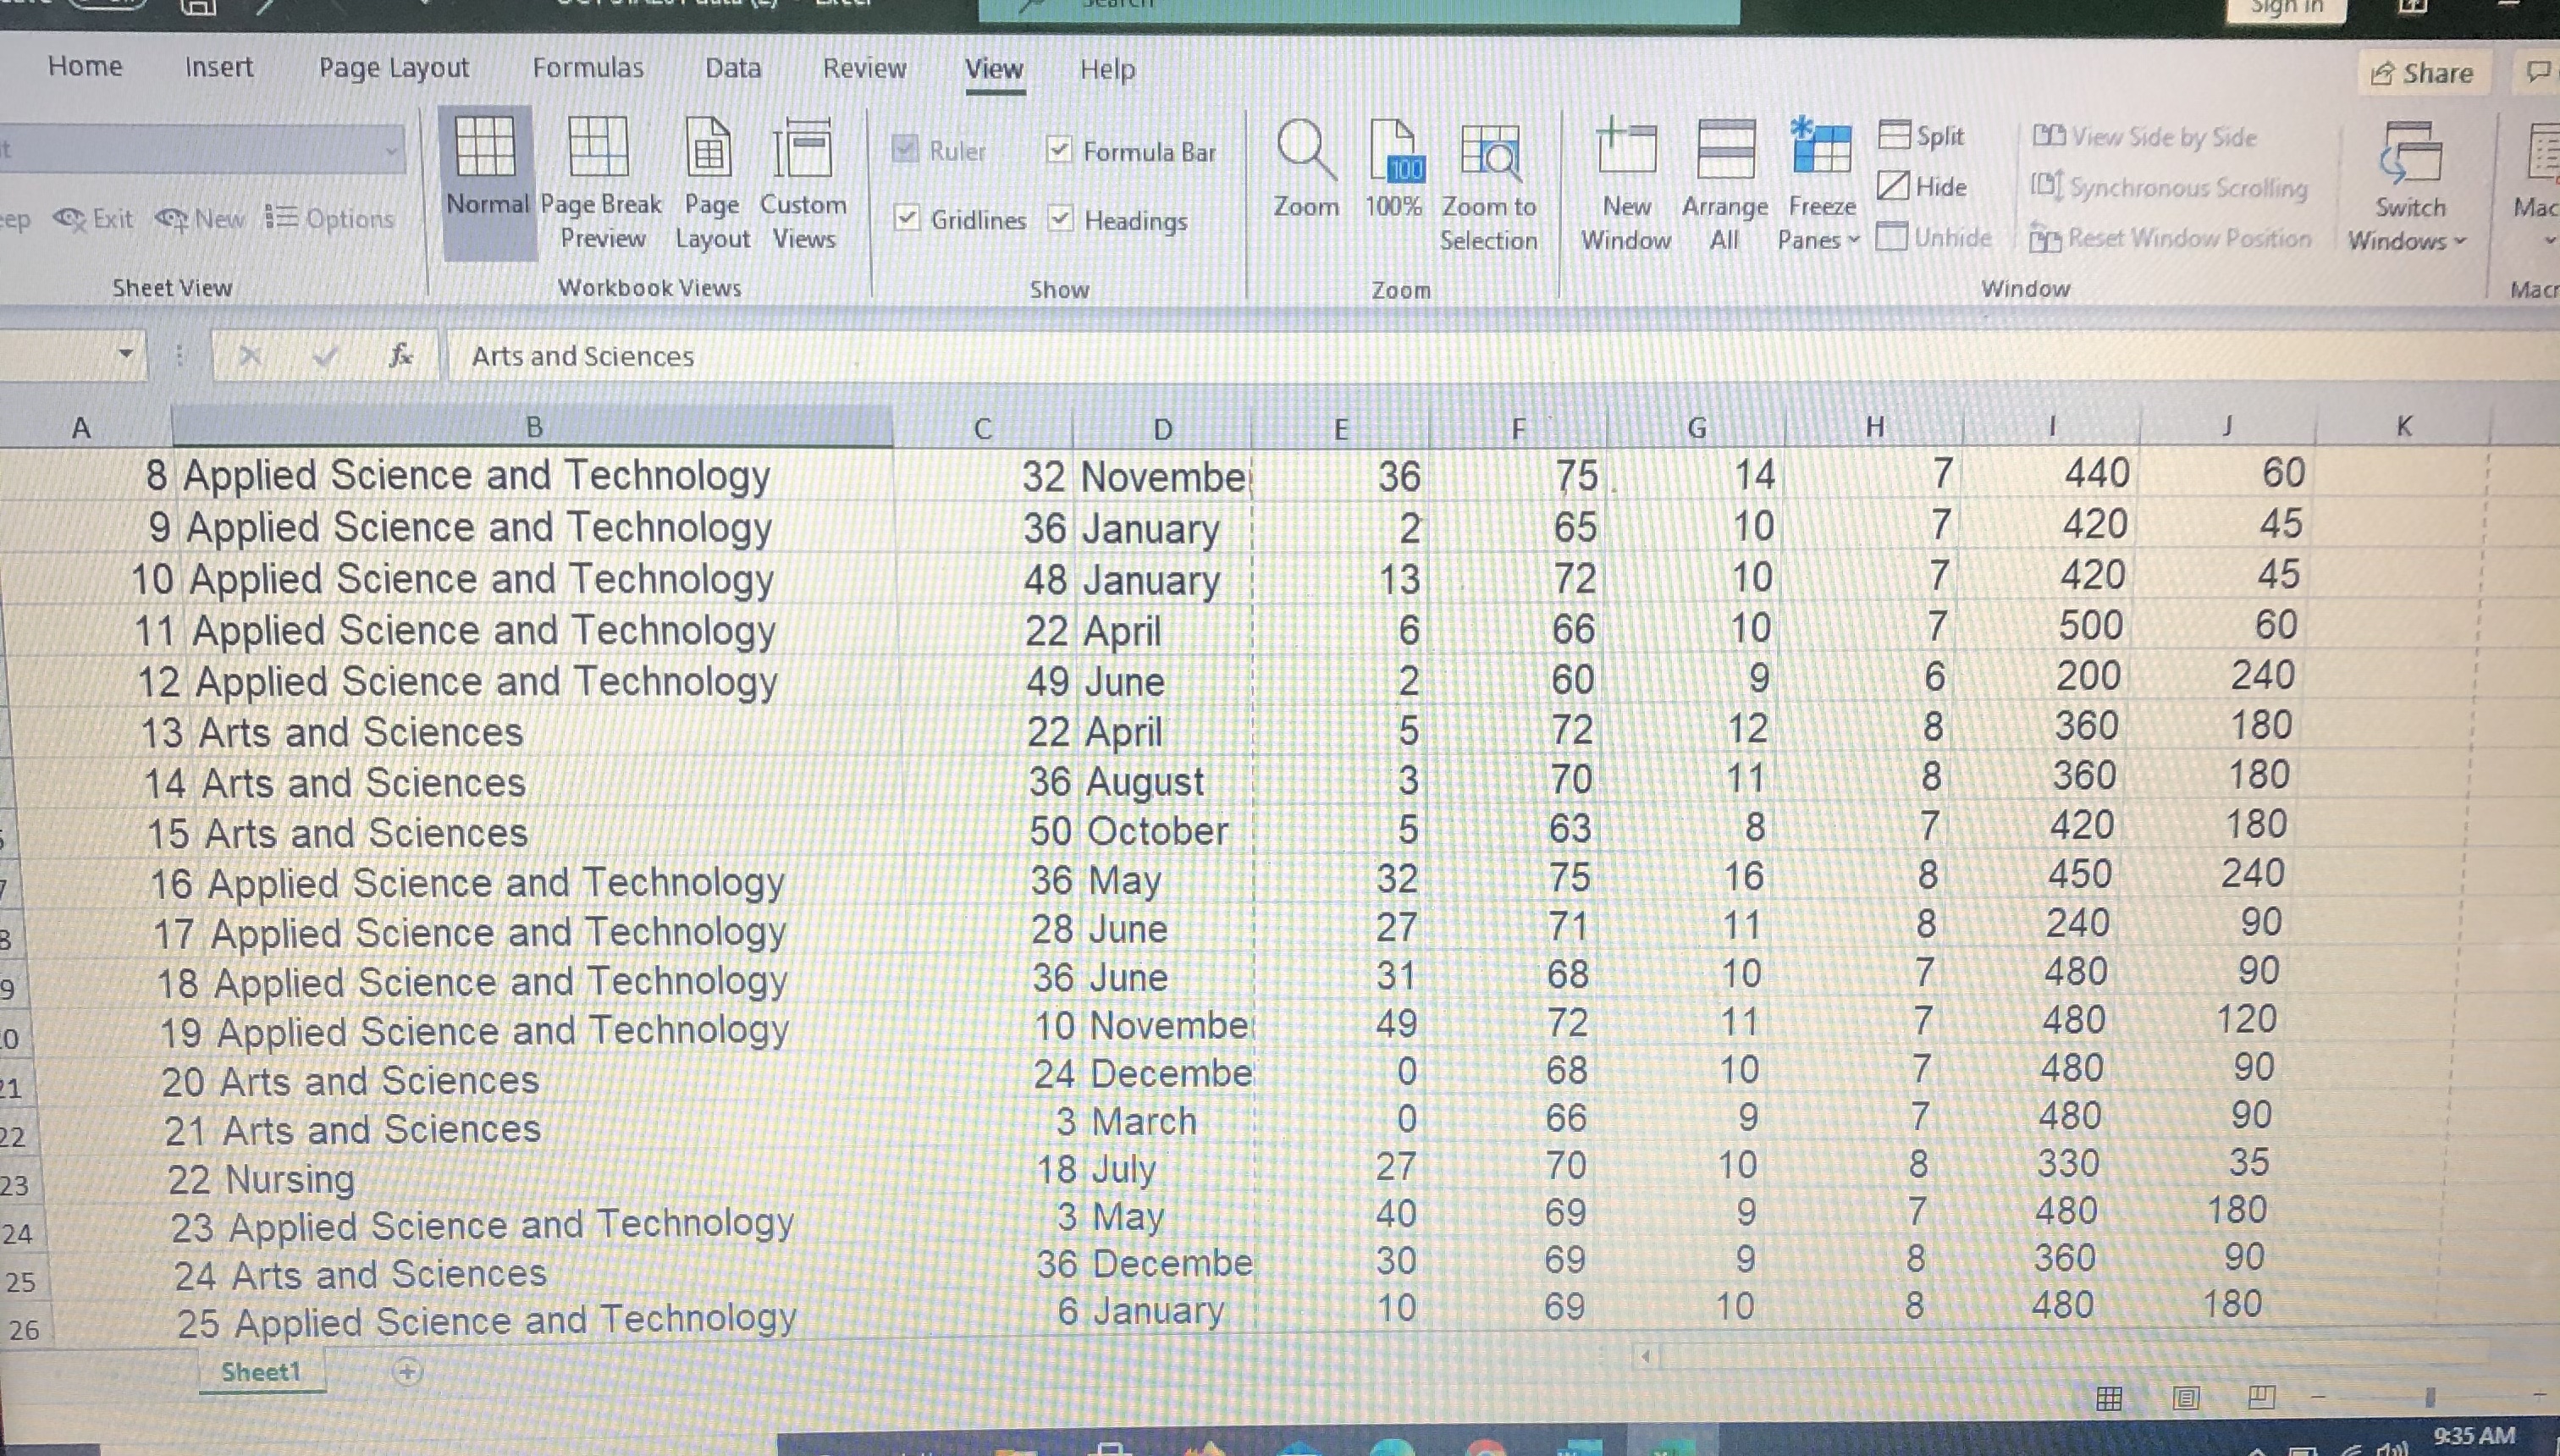
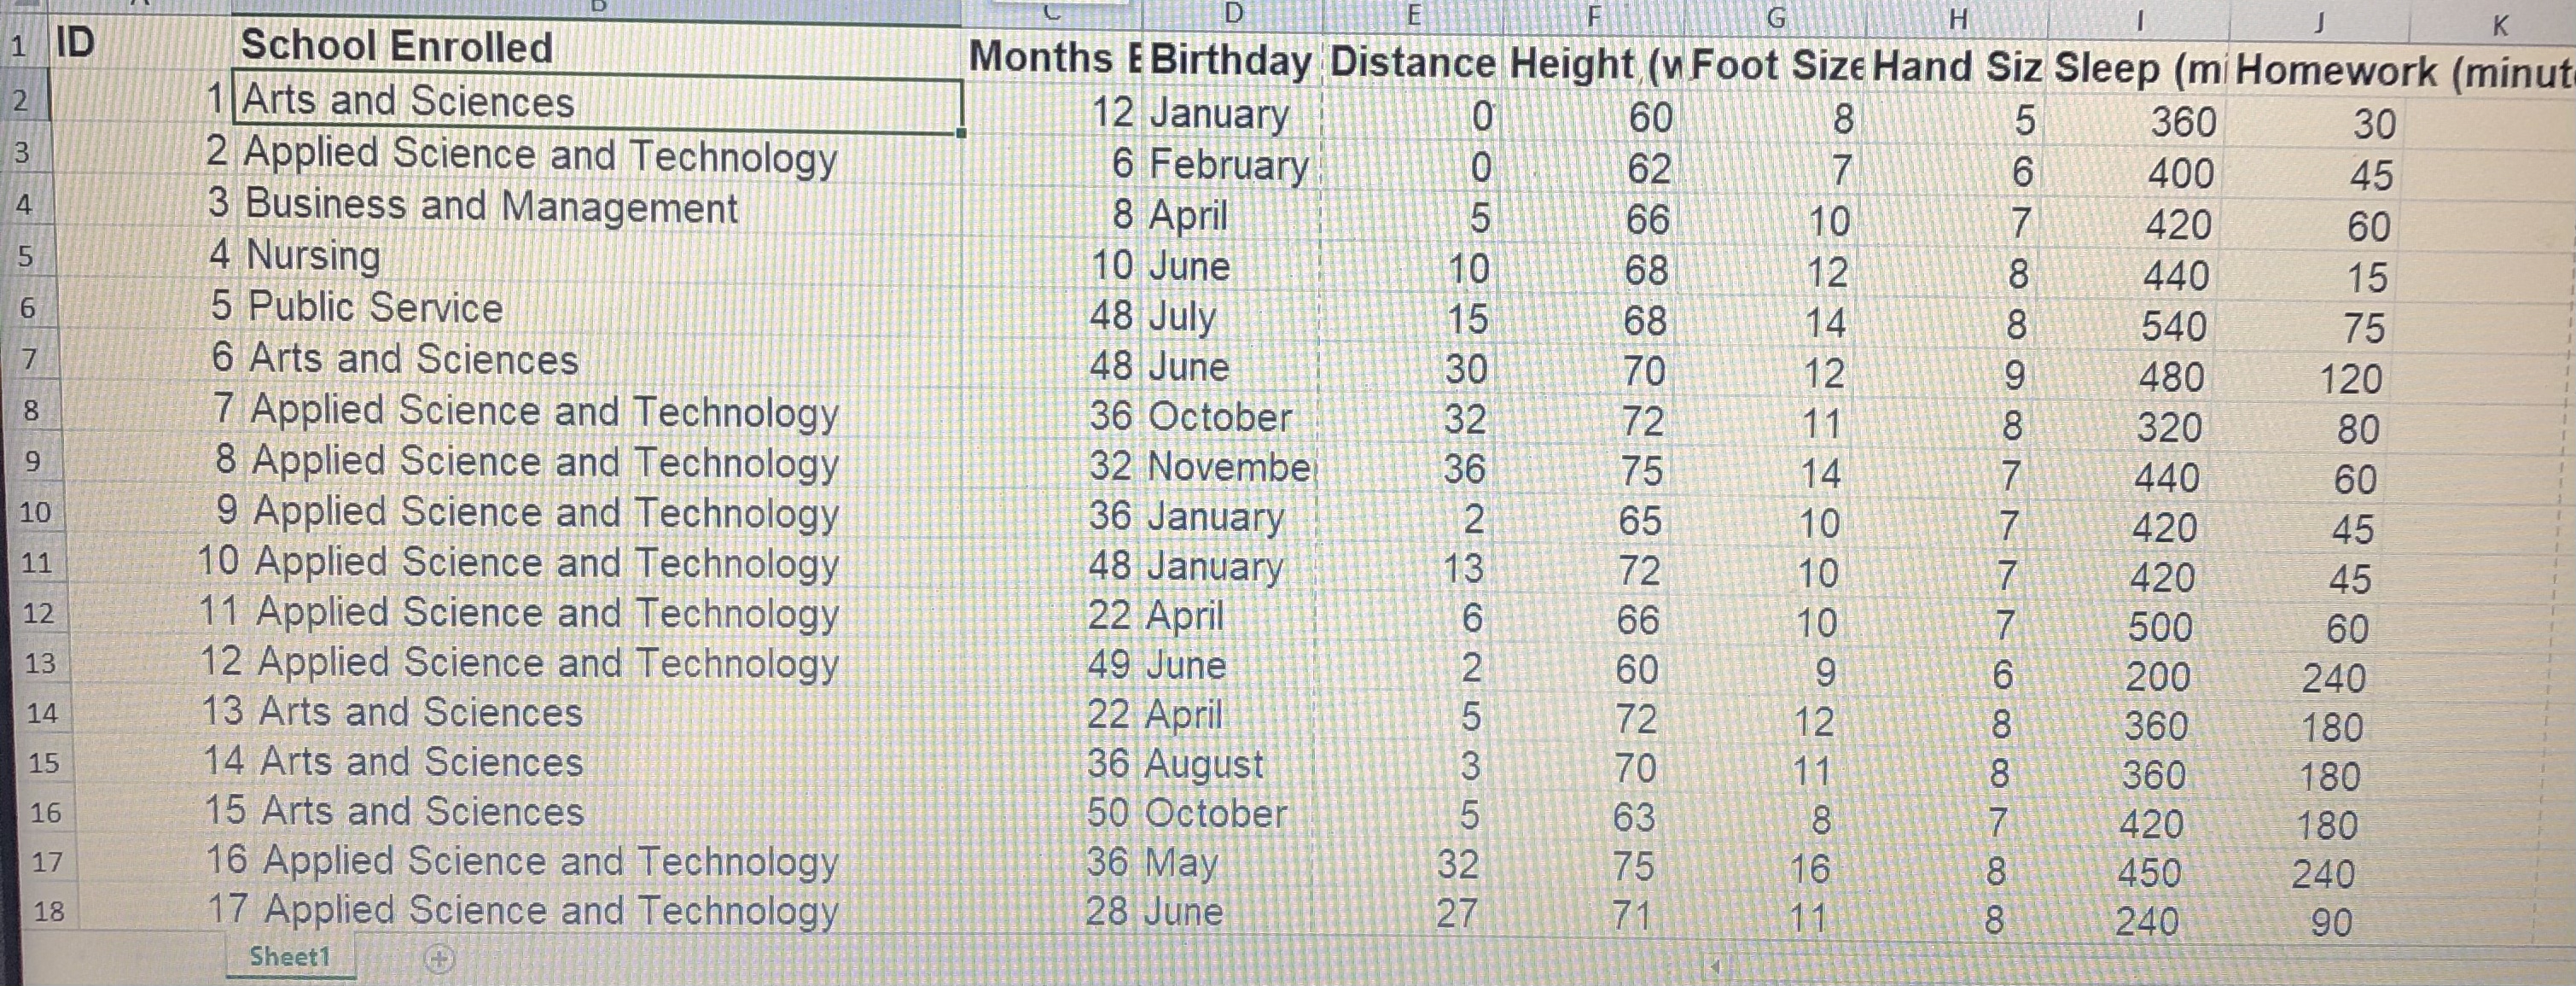
Sign in Home Insert Page Layout Formulas Data Review View Help Share Ruler Formula Bar 100 HO Split DO View Side by Side ep Exit New Options Normal Page Break Page Custom Hide Gridlines |Headings Zoom 100% Zoom to New Arrange Freeze IDI Synchronous Scrolling Switch Ma Preview Layout Views Selection Window All Panes Unhide Ly Reset Window Position Windows Sheet View Workbook Views Show Zoom Window Mac Arts and Sciences A B C D E G H K 8 Applied Science and Technology 32 Novembe 36 75 14 440 60 9 Applied Science and Technology 36 January 2 65 10 420 45 10 Applied Science and Technology 48 January 13 72 10 420 45 11 Applied Science and Technology 22 April 6 66 10 500 60 12 Applied Science and Technology 49 June 19 200 240 13 Arts and Sciences 22 April 360 180 14 Arts and Sciences 36 August 360 180 50 October NOW 15 Arts and Sciences 420 180 16 Applied Science and Technology 36 May 450 240 17 Applied Science and Technology 28 June 27 240 90 18 Applied Science and Technology 36 June 31 480 90 19 Applied Science and Technology 10 November 49 480 120 20 Arts and Sciences 24 December 480 90 21 Arts and Sciences 3 March 0 66 480 90 22 Nursing 18 July 70 330 35 23 Applied Science and Technology 3 May 40 69 480 180 24 30 69 360 90 25 24 Arts and Sciences 36 Decembe 6 January 10 69 480 180 26 25 Applied Science and Technology Sheet1 9:35 AMD F GI H K 1 D School Enrolled Months E Birthday Distance Height (v Foot Size Hand Siz Sleep (mi Homework (minut N 1 Arts and Sciences 12 January 60 360 30 2 Applied Science and Technology 6 February 62 400 45 4 3 Business and Management 8 April 66 420 60 5 4 Nursing 10 June 10 68 12 440 15 6 5 Public Service 48 July 15 68 14 540 75 6 Arts and Sciences 48 June 30 70 480 120 8 7 Applied Science and Technology 36 October 32 72 320 80 9 8 Applied Science and Technology 32 November 36 75 440 60 10 9 Applied Science and Technology 36 January 2 65 420 45 NOOOODEN 11 10 Applied Science and Technology 48 January 12 72 420 45 12 11 Applied Science and Technology 22 April 6 56 500 60 13 12 Applied Science and Technology 49 June 200 240 14 13 Arts and Sciences 22 April 2 360 180 15 14 Arts and Sciences 36 August 70 360 180 16 15 Arts and Sciences 50 October 63 420 180 17 16 Applied Science and Technology 36 May 32 75 450 240 18 17 Applied Science and Technology 28 June 27 71 240 90 Sheet1
Step by Step Solution
There are 3 Steps involved in it

Get step-by-step solutions from verified subject matter experts