

Question: Use the shared results from the Student Data Table to complete the following problems. Make sure to show all work/calculations. Calculate the Pearson correlation between
Use the shared results from the Student Data Table to complete the following problems. Make sure to show all work/calculations.
- Calculate the Pearson correlation between hand and foot size for members of this STA-201 class. Graph the relationship, determine a hypothesis to test this relationship, and statistically test this hypothesis using alpha=0.05. Interpret all results in a paragraph citing the appropriate statistics.
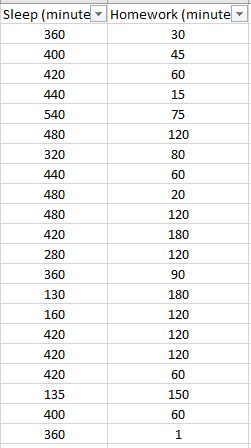
- Calculate the simple linear regression to determine if the amount ofsleep (y) can be predicted by time spent on homework (x). Graph the relationship and determine, numerically, if there are any outliers. Interpret all results in a paragraph citing the appropriate statistics.
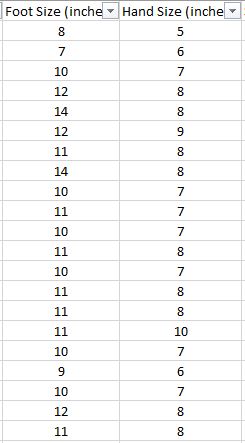

Foot Size (inche * Hand Size (inche 5 7 10 12 14 12 11 14 C0 00 00 4 00 00 | 10 11 10 11 10 11 CO CO 11 11 10 10 9 10 12 CO CO 11
Step by Step Solution
There are 3 Steps involved in it
1 Expert Approved Answer
Step: 1 Unlock

Question Has Been Solved by an Expert!
Get step-by-step solutions from verified subject matter experts
Step: 2 Unlock
Step: 3 Unlock