

Question: Use the template and complete the identified financial ratios for best buy for the prior 3-5 years and the identified financial ratios for 3-5 key
- Use the template and complete the identified financial ratios for best buy for the prior 3-5 years and the identified financial ratios for 3-5 key competitors for the prior year, as described in the video.
- Write-up a well researched and well written summary of key performance indicators to paint a picture of the financial health of Best Buy and indicate what broad categories of strategies their financial position and trajectory suggests for them. Focus on synthesizing the information, not just listing out a bunch of numbers and ratios. For example, if they have seen 3+ years of steady decline, repositioning/downsizing may be more appropriate; if they have strong financials and a lot
- of cash/leverage ability, expansion of some sort may be appropriate. The key is to tell us what they numbers mean, not just tell what the numbers are.
- Use the template and complete the identified financial ratios for BEST BUY for the prior 3-5 years and the identified financial ratios for 3-5 key competitors for the prior year, as described in the video.
- Write-up a well researched and well written summary of key performance indicators to paint a picture of the financial health of BEST BUY and indicate what broad categories of strategies their financial position and trajectory suggests for them. Focus on synthesizing the information, not just listing out a bunch of numbers and ratios. For example, if they have seen 3+ years of steady decline, repositioning/downsizing may be more appropriate; if they have strong financials and a lot of cash/leverage ability, expansion of some sort may be appropriate. The key is to tell us what they numbers mean, not just tell what the numbers are.
- ALL SOURCES MUST COME FROM MERGENT INTELLECT AND MERGENT ONLINE
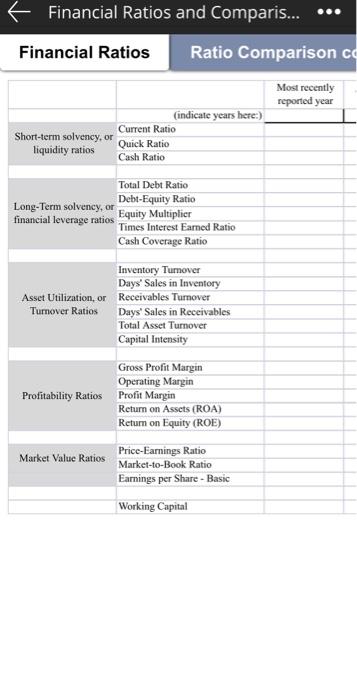
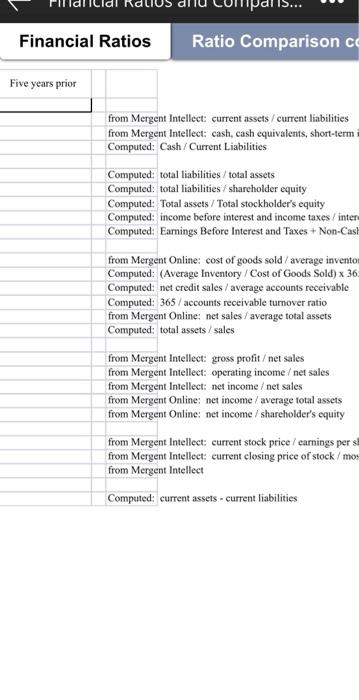
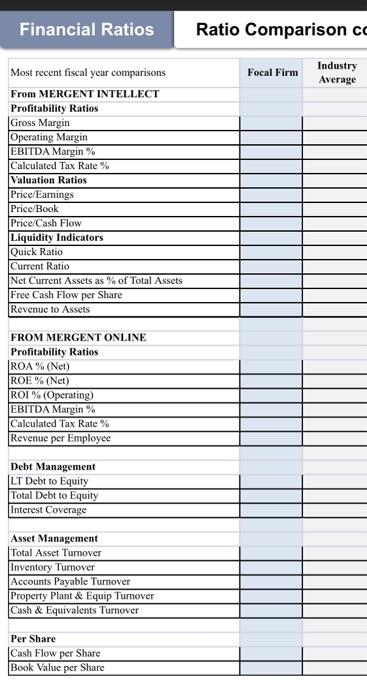
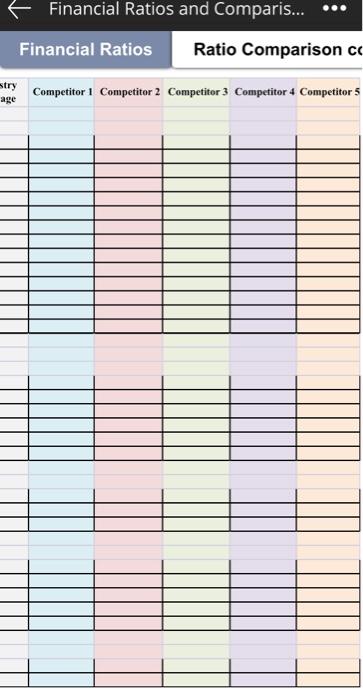
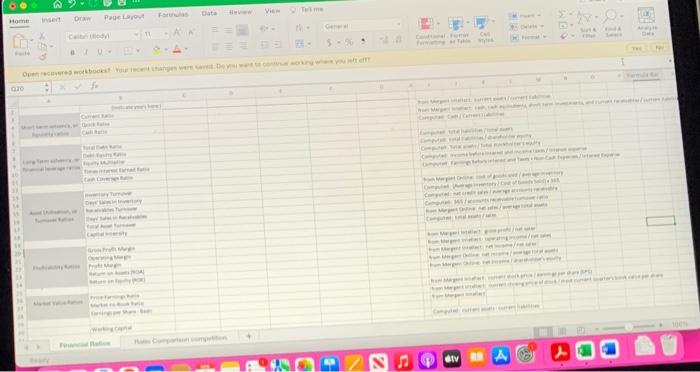
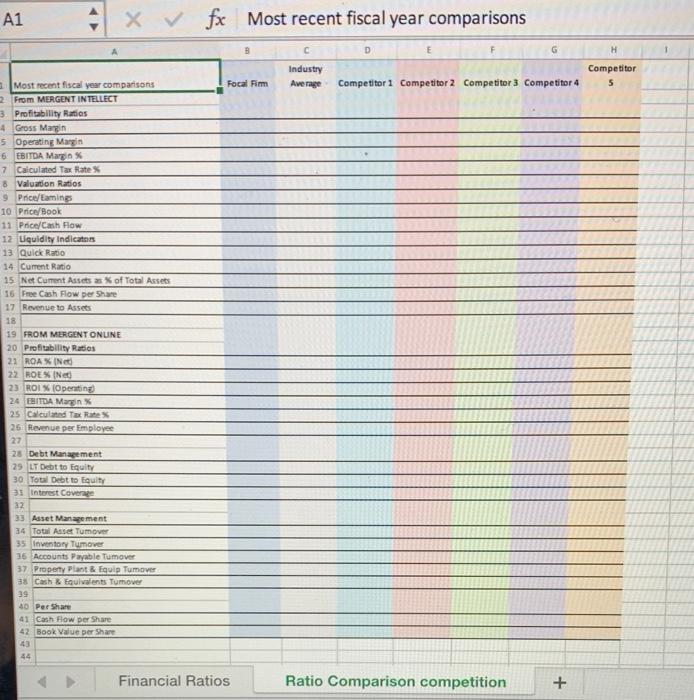
Vie Home D Pet . C GIV A1 + x fx Most recent fiscal year comparisons D E H Industry Average Competitor 5 Focal Fim Competitor 1 Competitor 2 Competitor 3 Competitor 4 Most recent fiscal year comparisons 2 From MERGENT INTELLECT 3. Profitability Ratios 4 Gross Margin 5 Operating Margin 6 EBITDA Margas 7 Calculated Tax Rate 8 Valuation Ratios 9 Price/aming 10 Price/Book 11 Price/Cash Flow 12 Liquidity Indicators 13 Quick Ratio 14 Current Ratio 15 Net Cument Assets ask of Total Assets 16 Free Cash Flow per Share 17 Revenue to Assets 18 19 FROM MERGENT ONUNE 20 Profitability Ratios 21 ROAX IN 22 HOLK IN 23 ROIX Opening 24 EBITDA Margins 25 Calculad Tax Rates 26 Revenue per Employee 27 25 Debt Management 29 LT Debt to Equity 30. Total Debt to Equity 31 Interest Coverage 32 33 Asset Management 34 Total Asset Tumover 35 Inventory Tumover 36 Accounts Payable Tumover 37 Property Plant & Equip Tumover 38 Cash & Equivalents Tumover 39 40 Per Share 41 Cash Row per Share 42 Book Value per Share 43 44 Financial Ratios Ratio Comparison competition + Financial Ratios and Comparis... Financial Ratios Ratio Comparison cc Most recently reported year (indicate years here:) Short-term solvency, or Current Ratio liquidity ratios Quick Ratio Cash Ratio Total Debt Ratio Long-Term solvency, or Debt-Equity Ratio financial leverage ratios Equity Multiplier Times Interest Eamed Ratio Cash Coverage Ratio Inventory Tumover Days' Sales in Inventory Asset Utilization, or Receivables Tumover Turnover Ratios Days' Sales in Receivables Total Asset Turnover Capital Intensity Gross Profit Margin Operating Margin Profitability Ratios Profit Margin Return on Assets (ROA) Retum on Equity (ROE) Market Value Ratios Price-Earnings Ratio Market-to-Book Ratio Earnings per Share - Basic Working Capital Financial Ratios Ratio Comparison co Five years prior from Mergent Intellect current assets / current liabilities from Mergent Intellect: cash, cash equivalents, short-term Computed: Cash/Current Liabilities Computed: total liabilities/total assets Computed: total liabilities / shareholder equity Computed: Total assets / Total stockholder's equity Computed: income before interest and income taxes / inter Computed: Earnings Before Interest and Taxes + Non-Cash from Mergent Online: cost of goods sold / average invento Computed: (Average Inventory / Cost of Goods Sold) x 36 Computedt net credit sales / average accounts receivable Computed: 365 / accounts receivable turnover ratio from Mergent Online: net sales/ average total assets Computed: total assets/ sales from Mergent Intellect: gross profitet sales from Mergent Intellect: operating income / net sales from Mergent Intellect: net income / net sales from Mergent Online: net income / average total assets from Mergent Online: net income / shareholder's equity from Mergent Intellect: current stock price / earnings per s from Mergent Intellect: current closing price of stock/mus from Mergent Intellect Computed: current assets - current liabilities Financial Ratios Ratio Comparison cc Focal Firm Industry Average Most recent fiscal year comparisons From MERGENT INTELLECT Profitability Ratios Gross Margin Operating Margin EBITDA Margin% Calculated Tax Rate % Valuation Ratios Price/Earnings Price/Book Price/Cash Flow Liquidity Indicators Quick Ratio Current Ratio Net Current Assets as % of Total Assets Free Cash Flow per Share Revenue to Assets FROM MERGENT ONLINE Profitability Ratios ROA % (Net) ROE % (Net) ROI % (Operating) EBITDA Margin% Calculated Tax Rate % Revenue per Employee Debt Management LT Debt to Equity Total Debt to Equity Interest Coverage Asset Management Total Asset Turnover Inventory Turnover Accounts Payable Turnover Property Plant & Equip Turnover Cash & Equivalents Turnover Per Share Cash Flow per Share Book Value per Share Financial Ratios and Comparis... ** Financial Ratios Ratio Comparison co stry age Competitor 1 Competitor 2 Competitor 3 Competitor 4 Competitor 5 Vie Home D Pet . C GIV A1 + x fx Most recent fiscal year comparisons D E H Industry Average Competitor 5 Focal Fim Competitor 1 Competitor 2 Competitor 3 Competitor 4 Most recent fiscal year comparisons 2 From MERGENT INTELLECT 3. Profitability Ratios 4 Gross Margin 5 Operating Margin 6 EBITDA Margas 7 Calculated Tax Rate 8 Valuation Ratios 9 Price/aming 10 Price/Book 11 Price/Cash Flow 12 Liquidity Indicators 13 Quick Ratio 14 Current Ratio 15 Net Cument Assets ask of Total Assets 16 Free Cash Flow per Share 17 Revenue to Assets 18 19 FROM MERGENT ONUNE 20 Profitability Ratios 21 ROAX IN 22 HOLK IN 23 ROIX Opening 24 EBITDA Margins 25 Calculad Tax Rates 26 Revenue per Employee 27 25 Debt Management 29 LT Debt to Equity 30. Total Debt to Equity 31 Interest Coverage 32 33 Asset Management 34 Total Asset Tumover 35 Inventory Tumover 36 Accounts Payable Tumover 37 Property Plant & Equip Tumover 38 Cash & Equivalents Tumover 39 40 Per Share 41 Cash Row per Share 42 Book Value per Share 43 44 Financial Ratios Ratio Comparison competition + Financial Ratios and Comparis... Financial Ratios Ratio Comparison cc Most recently reported year (indicate years here:) Short-term solvency, or Current Ratio liquidity ratios Quick Ratio Cash Ratio Total Debt Ratio Long-Term solvency, or Debt-Equity Ratio financial leverage ratios Equity Multiplier Times Interest Eamed Ratio Cash Coverage Ratio Inventory Tumover Days' Sales in Inventory Asset Utilization, or Receivables Tumover Turnover Ratios Days' Sales in Receivables Total Asset Turnover Capital Intensity Gross Profit Margin Operating Margin Profitability Ratios Profit Margin Return on Assets (ROA) Retum on Equity (ROE) Market Value Ratios Price-Earnings Ratio Market-to-Book Ratio Earnings per Share - Basic Working Capital Financial Ratios Ratio Comparison co Five years prior from Mergent Intellect current assets / current liabilities from Mergent Intellect: cash, cash equivalents, short-term Computed: Cash/Current Liabilities Computed: total liabilities/total assets Computed: total liabilities / shareholder equity Computed: Total assets / Total stockholder's equity Computed: income before interest and income taxes / inter Computed: Earnings Before Interest and Taxes + Non-Cash from Mergent Online: cost of goods sold / average invento Computed: (Average Inventory / Cost of Goods Sold) x 36 Computedt net credit sales / average accounts receivable Computed: 365 / accounts receivable turnover ratio from Mergent Online: net sales/ average total assets Computed: total assets/ sales from Mergent Intellect: gross profitet sales from Mergent Intellect: operating income / net sales from Mergent Intellect: net income / net sales from Mergent Online: net income / average total assets from Mergent Online: net income / shareholder's equity from Mergent Intellect: current stock price / earnings per s from Mergent Intellect: current closing price of stock/mus from Mergent Intellect Computed: current assets - current liabilities Financial Ratios Ratio Comparison cc Focal Firm Industry Average Most recent fiscal year comparisons From MERGENT INTELLECT Profitability Ratios Gross Margin Operating Margin EBITDA Margin% Calculated Tax Rate % Valuation Ratios Price/Earnings Price/Book Price/Cash Flow Liquidity Indicators Quick Ratio Current Ratio Net Current Assets as % of Total Assets Free Cash Flow per Share Revenue to Assets FROM MERGENT ONLINE Profitability Ratios ROA % (Net) ROE % (Net) ROI % (Operating) EBITDA Margin% Calculated Tax Rate % Revenue per Employee Debt Management LT Debt to Equity Total Debt to Equity Interest Coverage Asset Management Total Asset Turnover Inventory Turnover Accounts Payable Turnover Property Plant & Equip Turnover Cash & Equivalents Turnover Per Share Cash Flow per Share Book Value per Share Financial Ratios and Comparis... ** Financial Ratios Ratio Comparison co stry age Competitor 1 Competitor 2 Competitor 3 Competitor 4 Competitor 5
Step by Step Solution
There are 3 Steps involved in it

Get step-by-step solutions from verified subject matter experts