

Question: Using a spreadsheet and the following data (enter the data into the spreadsheet in Columns A and B, so don't just copy-and-paste), calculate the
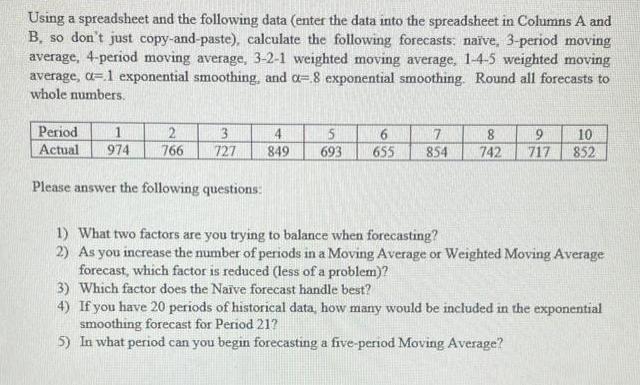
Using a spreadsheet and the following data (enter the data into the spreadsheet in Columns A and B, so don't just copy-and-paste), calculate the following forecasts: nave, 3-period moving average, 4-period moving average, 3-2-1 weighted moving average, 1-4-5 weighted moving average, d=1 exponential smoothing, and a-.8 exponential smoothing. Round all forecasts to whole numbers. Period 1 2 Actual 974 766 3 727 Please answer the following questions: 4 5 849 693 6 655 7 8 9 10 854 742 717 852 1) What two factors are you trying to balance when forecasting? 2) As you increase the number of periods in a Moving Average or Weighted Moving Average forecast, which factor is reduced (less of a problem)? 3) Which factor does the Nave forecast handle best? 4) If you have 20 periods of historical data, how many would be included in the exponential smoothing forecast for Period 217 5) In what period can you begin forecasting a five-period Moving Average?
Step by Step Solution
There are 3 Steps involved in it
To answer the questions lets first create a spreadsheet with the provided data in columns A and B A B 1 Period Actual 2 1 974 3 2 766 4 3 727 5 4 849 6 5 693 7 6 655 8 8 854 9 9 742 10 10 717 11 11 85... View full answer

Get step-by-step solutions from verified subject matter experts