

Question: Using C chart, please 1 Construct the LCL, UCL. 2 Plot your results. 3 Briefly provide with the recommendations based on your results. To monitor
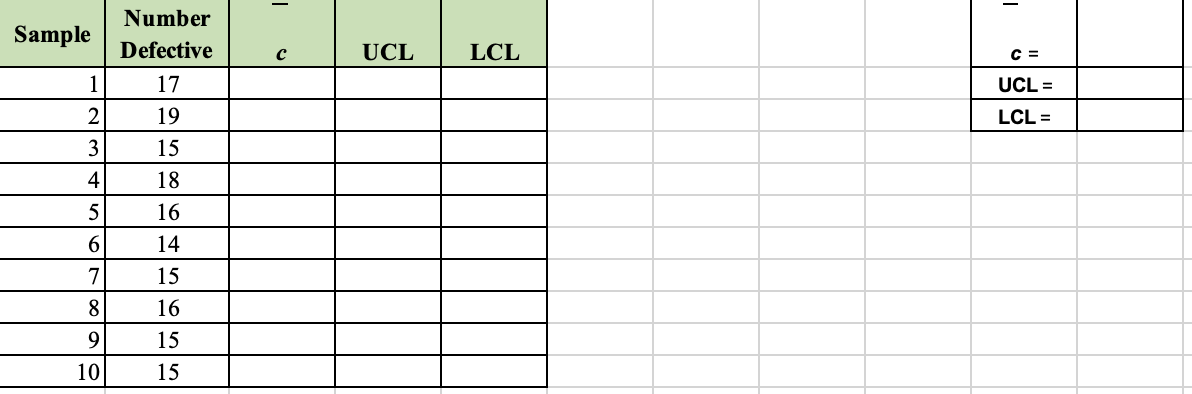
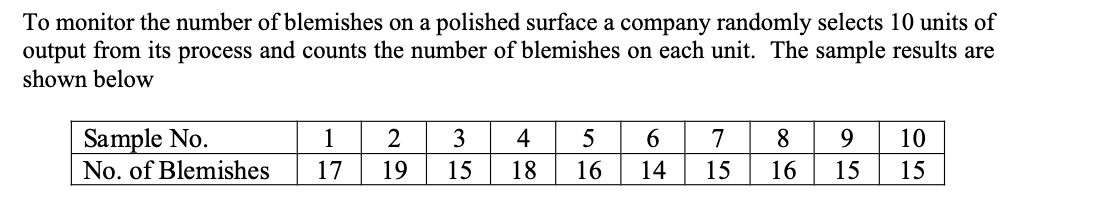 Using C chart, please 1 Construct the LCL, UCL. 2 Plot your results. 3 Briefly provide with the recommendations based on your results.
Step by Step Solution
There are 3 Steps involved in it
1 Expert Approved Answer
Step: 1 Unlock

Question Has Been Solved by an Expert!
Get step-by-step solutions from verified subject matter experts
Step: 2 Unlock
Step: 3 Unlock