

Question: begin{tabular}{|r|c|c|c|c|} hline Sample & NumberDefective & multicolumn{1}{c|}{ c } & UCL & LCL hline 1 & 17 & & & hline 2 &
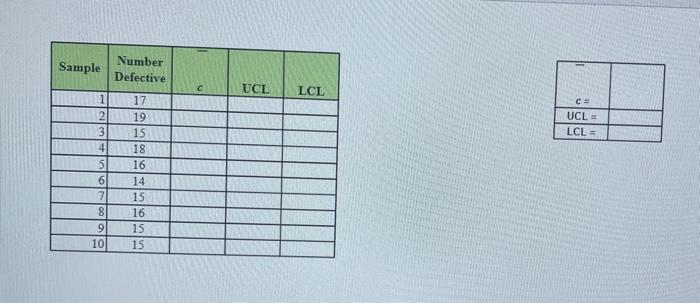
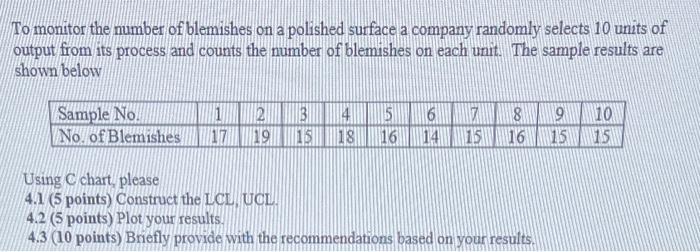
\begin{tabular}{|r|c|c|c|c|} \hline Sample & NumberDefective & \multicolumn{1}{c|}{ c } & UCL & LCL \\ \hline 1 & 17 & & & \\ \hline 2 & 19 & & & \\ \hline 3 & 15 & & & \\ \hline 4 & 18 & & & \\ \hline 5 & 16 & & & \\ \hline 6 & 14 & & & \\ \hline 7 & 15 & & & \\ \hline 8 & 16 & & & \\ \hline 9 & 15 & & & \\ \hline 10 & 15 & & & \\ \hline \end{tabular} \begin{tabular}{|c|c|} \hline & \\ c= & \\ \hline UCL= & \\ \hline LCL= & \\ \hline \end{tabular} To monitor the number of blemishes on a polished surface a company randomly selects 10 units of output from its process and counts the number of blemishes on each unit. The sample results are shown below Using C chart please 4.1 (5 points) Construct the LCL. UCL. 4.2 (5 points) Plot your results. 4.3 (10 points) Briefly provice with the recommendations based on your results
Step by Step Solution
There are 3 Steps involved in it

Get step-by-step solutions from verified subject matter experts