

Question: Using data from your Google Analytics Demo Account. Go to the audience overview. Display data from the time period: Feb 1, 2020 to August 1,
Using data from your Google Analytics Demo Account. Go to the audience overview. Display data from the time period: Feb 1, 2020 to August 1, 2020. Answer the following questions.
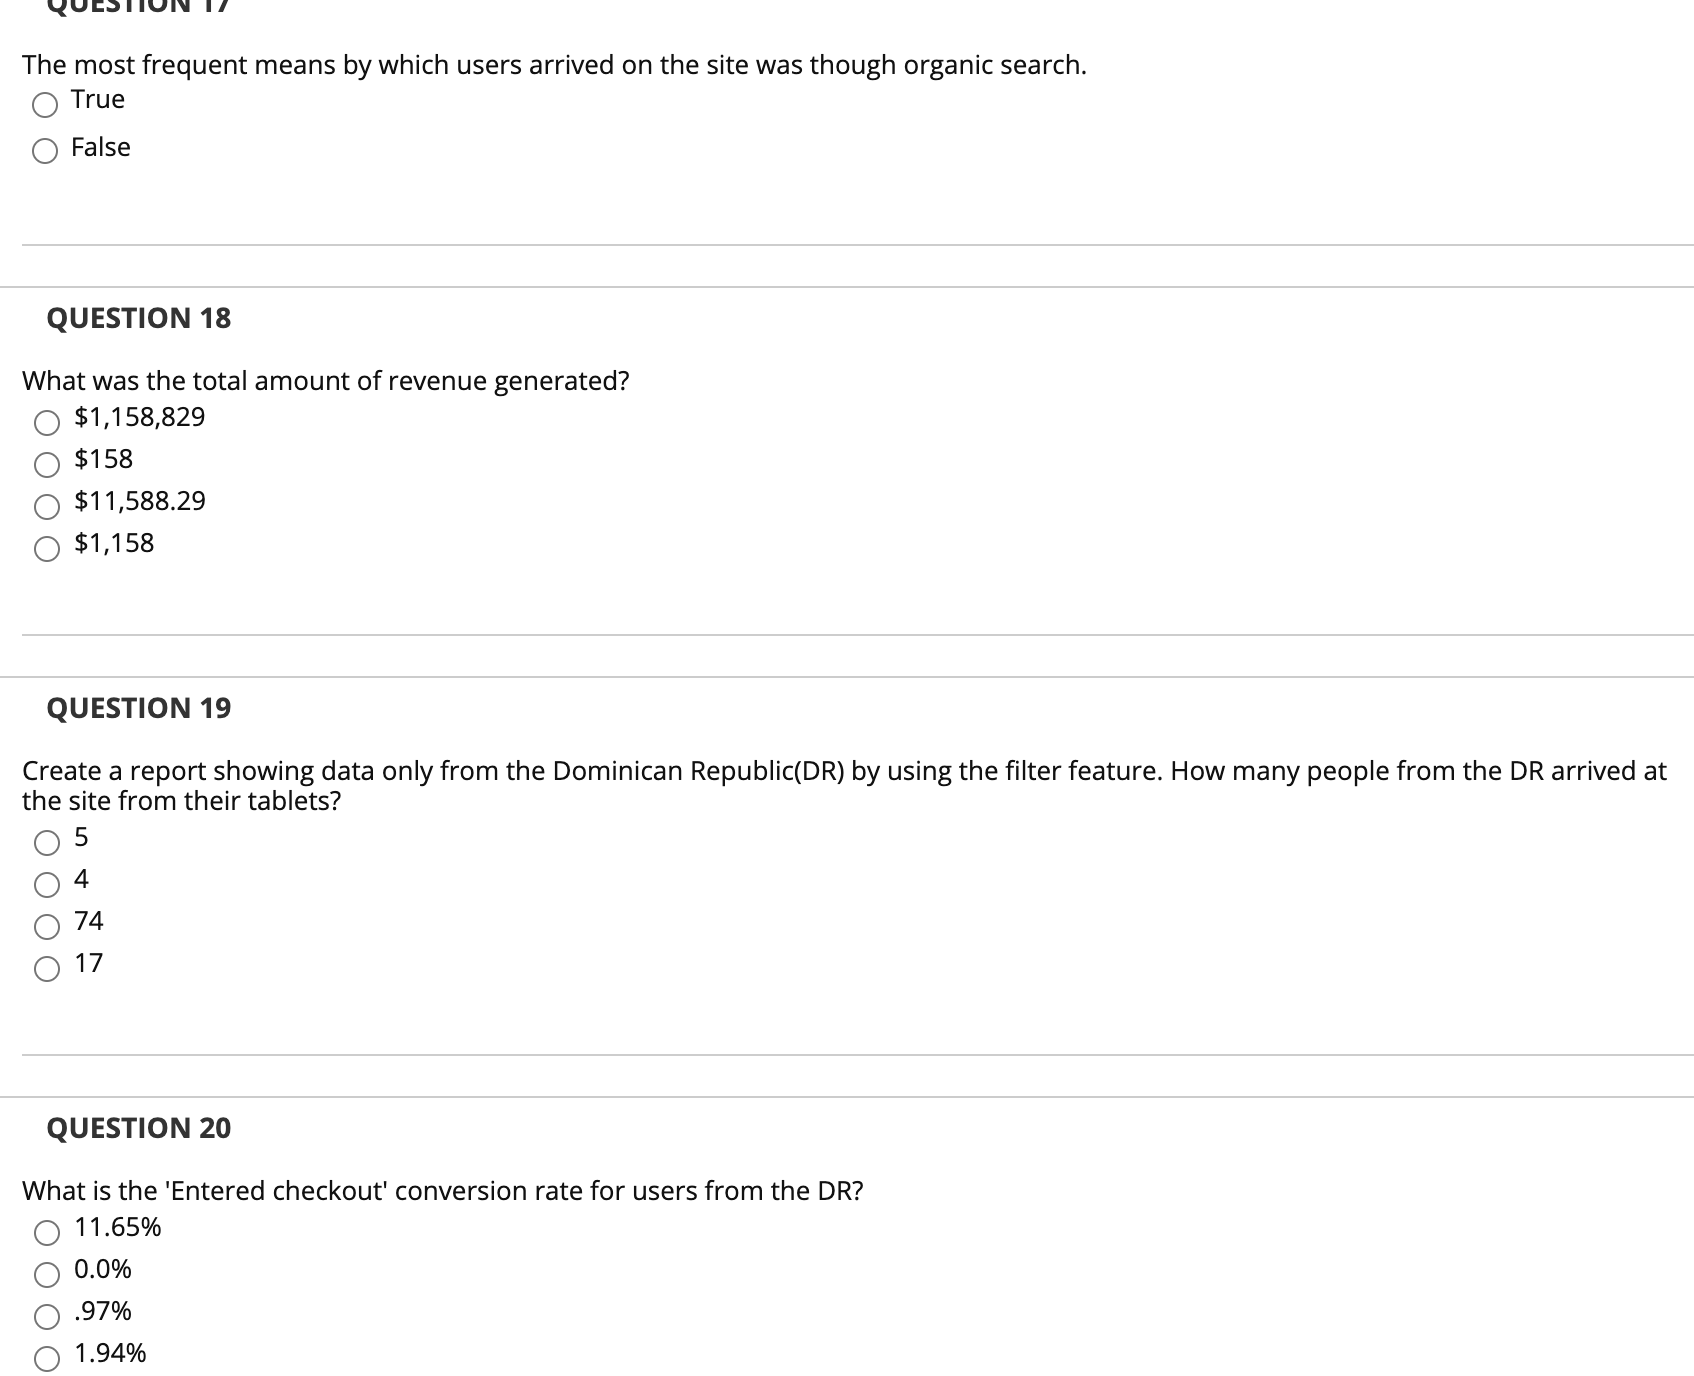
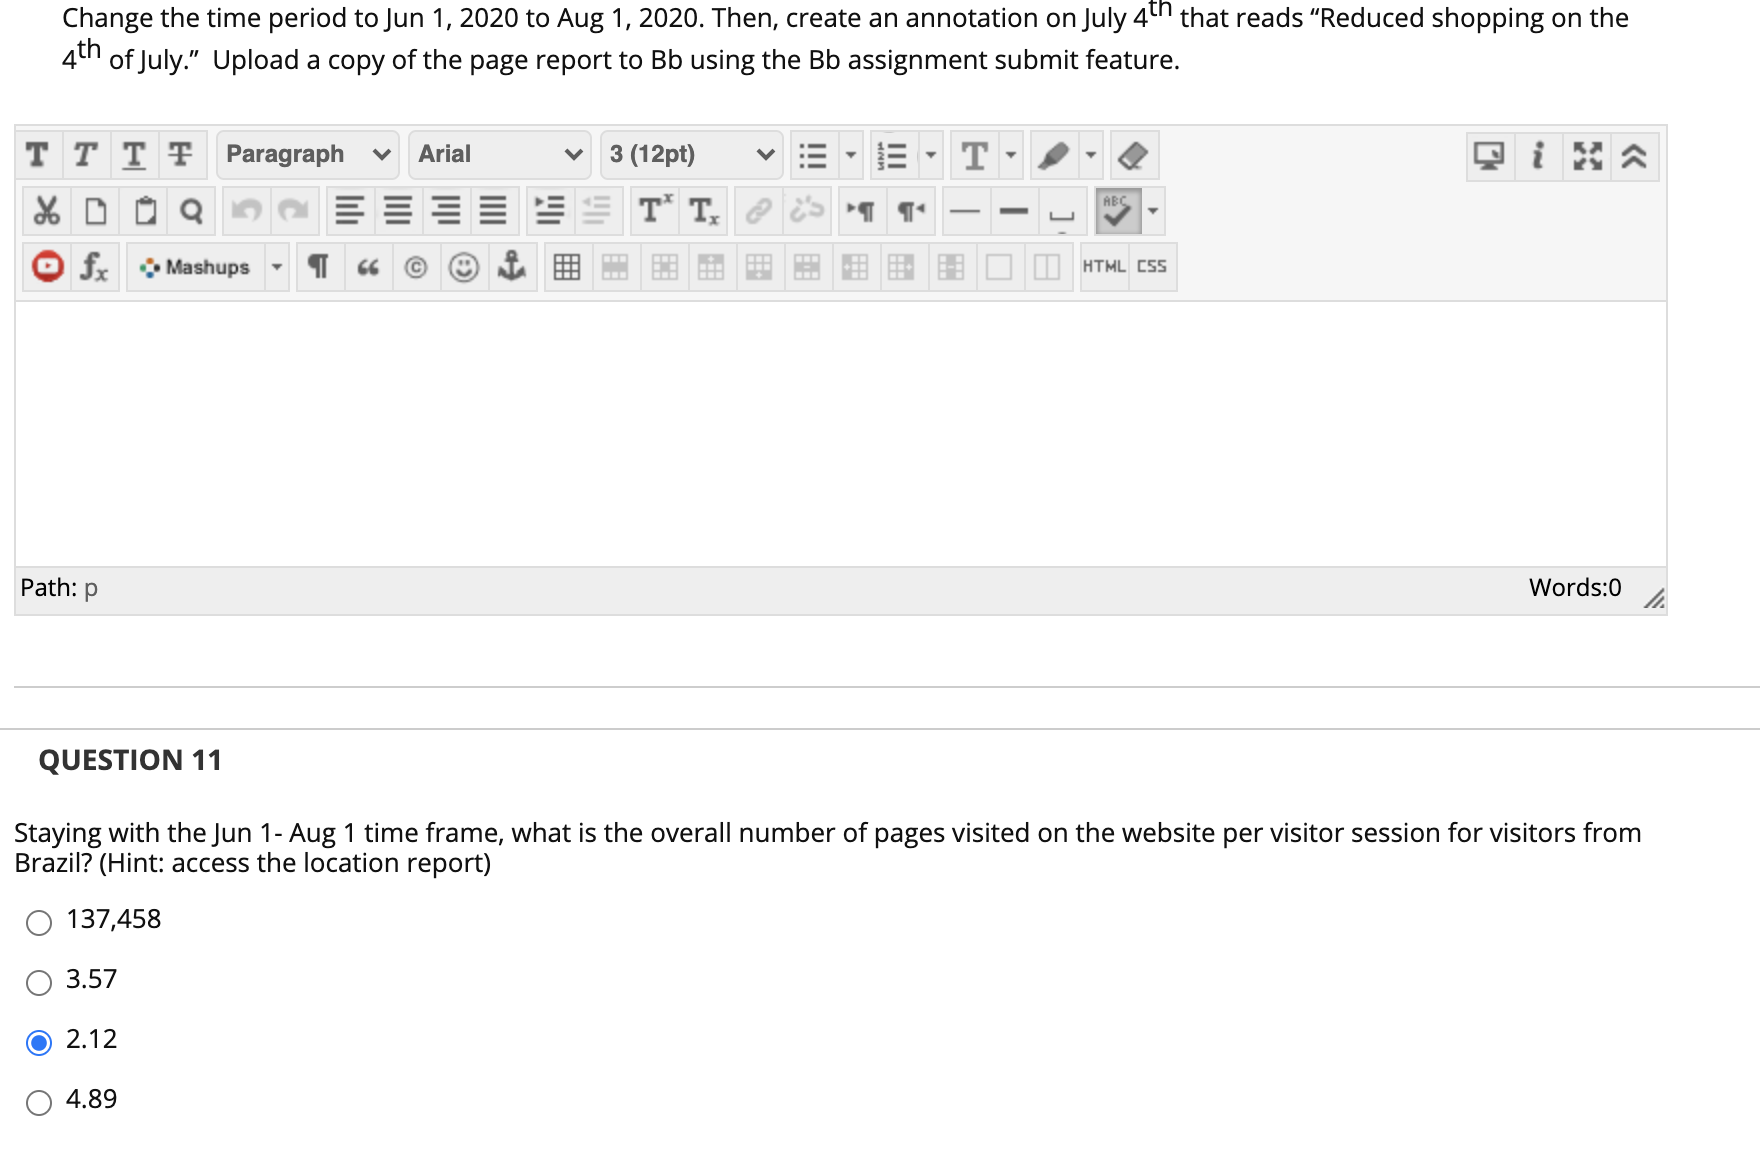
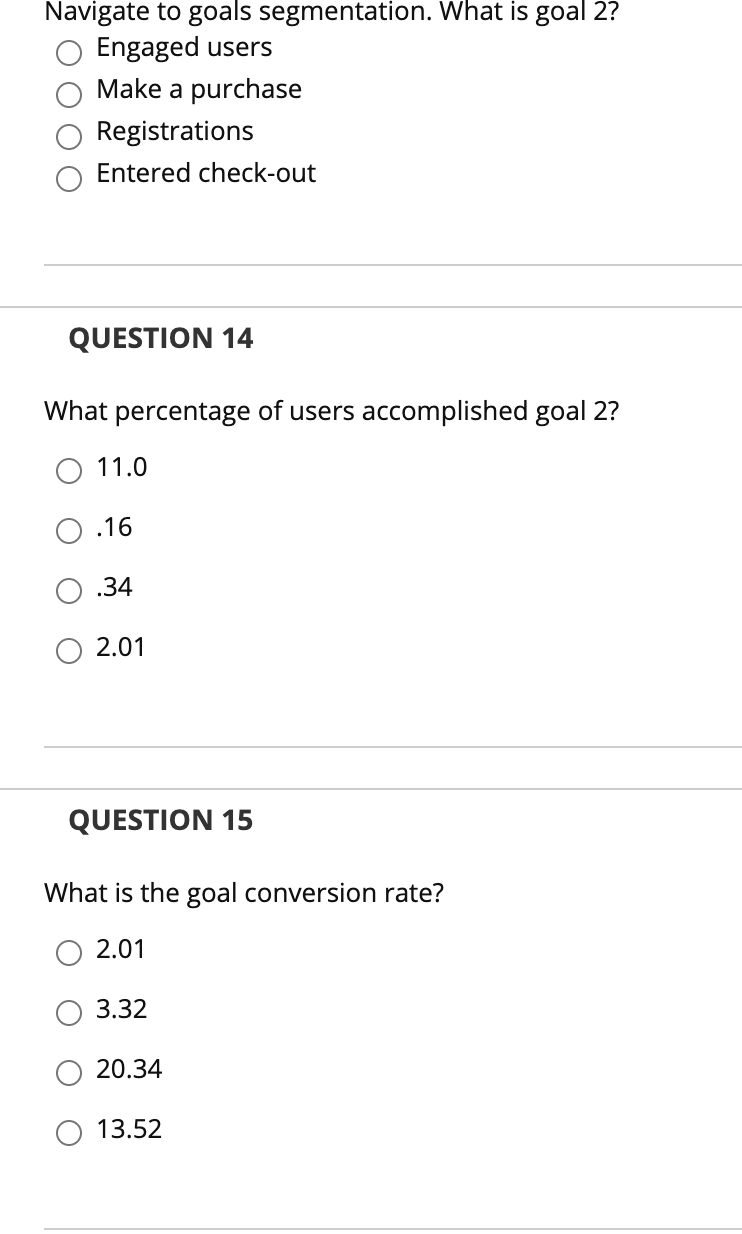
QUEDIIUI' II The most frequent means by which users arrived on the site was though organic search. 0 True 0 False QUESTION 18 What was the total amount of revenue generated? 0 $1,158,829 (3 $158 0 $11,588.29 0 $1,158 QUESTION 19 Create a report showing data only from the Dominican Republic(DR) by using the filter feature. How many people from the DR arrived at the site from their tablets? QUESTION 20 What is the 'Entered checkoutr conversion rate for users from the DR? 0 11.65% 0 0.0% O 97% O 1.94% Change the time period to Jun 1, 2020 to Aug 1, 2020. Then, create an annotation on July 4" that reads "Reduced shopping on the 4th of July." Upload a copy of the page report to Bb using the Bb assignment submit feature. TT TT Paragraph Arial v 3 (12pt) V T & DD Q BEE T* T. T ABC fx Mashups 66 C 10 0 HTML CSS Path: p Words:0 QUESTION 11 Staying with the Jun 1- Aug 1 time frame, what is the overall number of pages visited on the website per visitor session for visitors from Brazil? (Hint: access the location report) O 137,458 O 3.57 2.12 4.89Navigate to goals segmentation. What is goal 2? Q Engaged users 0 Make a purchase 0 Registrations O Entered check-out QUESTION 14 What percentage of users accomplished goal 2? O 11.0 0 .16 O .34 O 2.01 QUESTION 15 What is the goal conversion rate? Q 2.01 O 3.32 O 20.34 0 13.52
Step by Step Solution
There are 3 Steps involved in it

Get step-by-step solutions from verified subject matter experts