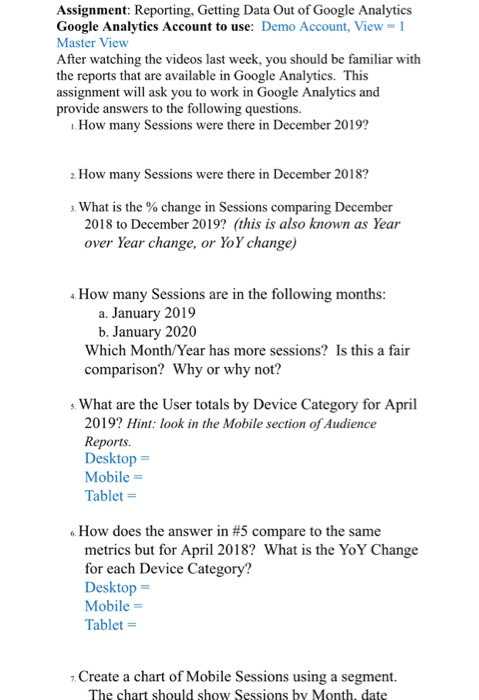
Question: Assignment: Reporting, Getting Data Out of Google Analytics Google Analytics Account to use: Demo Account, View = 1 Master View After watching the videos last

Assignment: Reporting, Getting Data Out of Google
Assignment: Reporting, Getting Data Out of Google Analytics Google Analytics Account to use: Demo Account, View = 1 Master View After watching the videos last week, you should be familiar with the reports that are available in Google Analytics. This assignment will ask you to work in Google Analytics and provide answers to the following questions. How many Sessions were there in December 2019? 2. How many Sessions were there in December 2018? What is the % change in Sessions comparing December 2018 to December 2019? (this is also known as Year over Year change, or YoY change) How many Sessions are in the following months: a. January 2019 b. January 2020 Which Month/Year has more sessions? Is this a fair comparison? Why or why not? What are the User totals by Device Category for April 2019? Hint: look in the Mobile section of Audience Reports. Desktop = Mobile = Tablet = How does the answer in #5 compare to the same metrics but for April 2018? What is the YoY Change for each Device Category? Desktop = Mobile = Tablet = Create a chart of Mobile Sessions using a segment. The chart should show Sessions by Month, date Assignment: Reporting, Getting Data Out of Google Analytics Google Analytics Account to use: Demo Account, View = 1 Master View After watching the videos last week, you should be familiar with the reports that are available in Google Analytics. This assignment will ask you to work in Google Analytics and provide answers to the following questions. How many Sessions were there in December 2019? 2. How many Sessions were there in December 2018? What is the % change in Sessions comparing December 2018 to December 2019? (this is also known as Year over Year change, or YoY change) How many Sessions are in the following months: a. January 2019 b. January 2020 Which Month/Year has more sessions? Is this a fair comparison? Why or why not? What are the User totals by Device Category for April 2019? Hint: look in the Mobile section of Audience Reports. Desktop = Mobile = Tablet = How does the answer in #5 compare to the same metrics but for April 2018? What is the YoY Change for each Device Category? Desktop = Mobile = Tablet = Create a chart of Mobile Sessions using a segment. The chart should show Sessions by Month, date

Step by Step Solution

There are 3 Steps involved in it

1 Expert Approved Answer
Step: 1 Unlock blur-text-image
Question Has Been Solved by an Expert!

Get step-by-step solutions from verified subject matter experts

Step: 2 Unlock
Step: 3 Unlock

Students Have Also Explored These Related General Management Questions!