

Question: Using Graphs to Analyze Reaction Kinetics 12 ipoint The decompesition of N2O5 at 45C was monitored and its concentration was recorded over a span of
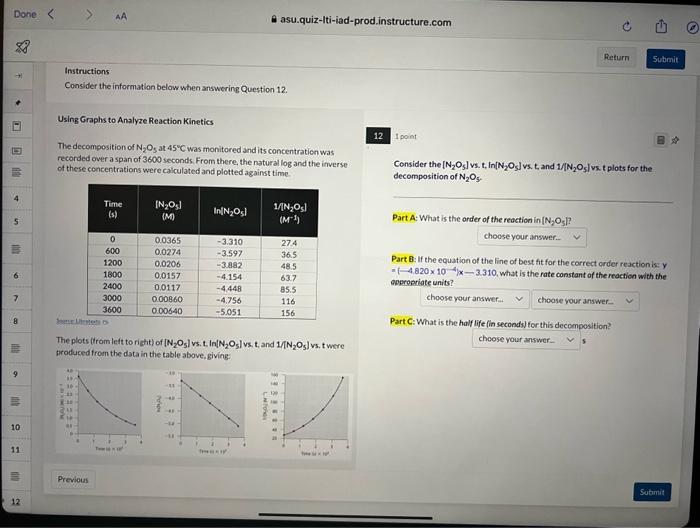
Using Graphs to Analyze Reaction Kinetics 12 ipoint The decompesition of N2O5 at 45C was monitored and its concentration was recorded over a span of 3600 seconds. From there, the natural log and the inverse of these concentrations were calculated and pletted against time. Consider the [N2O5] vs. t, In [N2O5] vs. t, and 1/N2O5 i vs. t plots for the decomposition of N2O5. Part A: What is the order of the reaction in [N2O5] ? Part 8: If the equation of the line of best fit for the correct order reaction is: y - [4.820104/x3.310, what is the rate constant of the reaction with the aperpariate units? Part C: What is the half life fin seconds) for this decomposition? The plots (from left to right) of [N2O5] vs. t. In [N2O5] vs, t. and U[N2O5] vs, t were troduced from the data in the table above, giving
Step by Step Solution
There are 3 Steps involved in it

Get step-by-step solutions from verified subject matter experts