

Question: Using Iris Species Dataset in the link https://www.kaggle.com/uciml/iris 1. Using Python, Seaborn, and Matplotlib in Jupyter Notebook, show scatter plots for sepal (length and width)
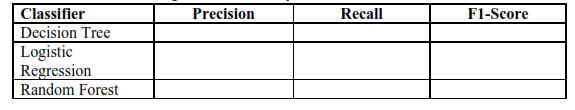
Using Iris Species Dataset in the link https://www.kaggle.com/uciml/iris 1. Using Python, Seaborn, and Matplotlib in Jupyter Notebook, show scatter plots for sepal (length and width) and petal (length and width) with respect to the target variable. 2. Develop classification model using Decision Tree, Logistic Regression and Random Forest. 3. Validate the models using 10-fold cross-validation and compare the Precision, Recall , and F1-Score for each classifier and put them in a Panda data frame in the following format. Print the data frame along with its summary statistics.
\f
Step by Step Solution
There are 3 Steps involved in it
1 Expert Approved Answer
Step: 1 Unlock

Question Has Been Solved by an Expert!
Get step-by-step solutions from verified subject matter experts
Step: 2 Unlock
Step: 3 Unlock