

Question: Using Mathematica, complete the problem below 3. Graph the following solids using the Region Plot3D command. Rotate each solid to get set a decent viewpoint
Using Mathematica, complete the problem below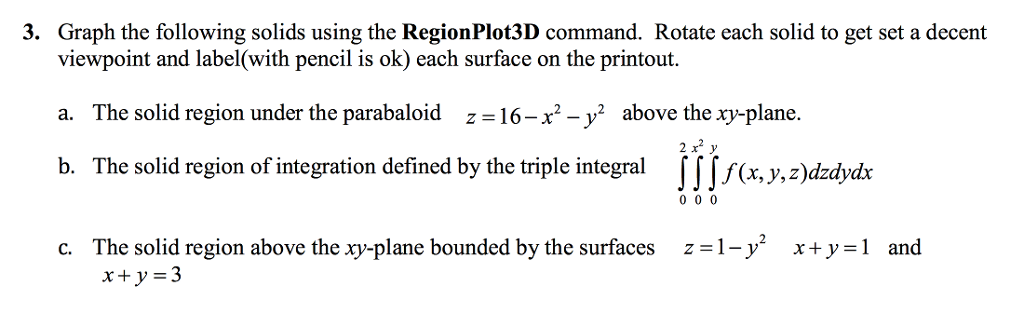
3. Graph the following solids using the Region Plot3D command. Rotate each solid to get set a decent viewpoint and label(with pencil is ok) each surface on the printout. a. The solid region under the parabaloid z = 16-x2-y2 above the xy-plane. b. The solid region of integration defined by the triple integral f[[f(x, y.z)dzdydx c. The solid region above the xy-plane bounded by the surfaces z = 1-y2 x +y = 1 and xty 3 3. Graph the following solids using the Region Plot3D command. Rotate each solid to get set a decent viewpoint and label(with pencil is ok) each surface on the printout. a. The solid region under the parabaloid z = 16-x2-y2 above the xy-plane. b. The solid region of integration defined by the triple integral f[[f(x, y.z)dzdydx c. The solid region above the xy-plane bounded by the surfaces z = 1-y2 x +y = 1 and xty 3
Step by Step Solution
There are 3 Steps involved in it

Get step-by-step solutions from verified subject matter experts