

Question: Using Matlab: 2. Use least-squares regression to fit a straight line to r 6 7 15 17 21 23 29 29 37 39 y 29
Using Matlab: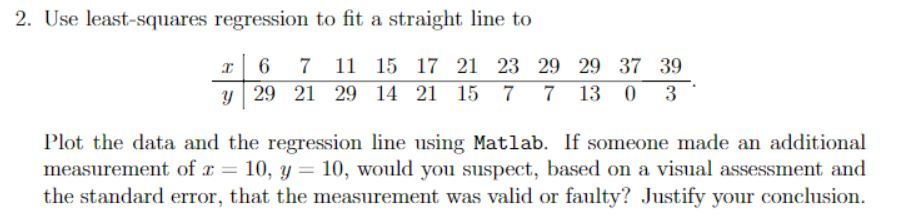
2. Use least-squares regression to fit a straight line to r 6 7 15 17 21 23 29 29 37 39 y 29 21 29 14 21 15 7 7 13 0 3 Plot the data and the regression ine using Matlab. If someone made an additional measurement of 2:10, y 10, would you suspect, based on a visual assessment and the standard error, that the measurement was valid or faulty? Justify your conclusion
Step by Step Solution
There are 3 Steps involved in it
1 Expert Approved Answer
Step: 1 Unlock

Question Has Been Solved by an Expert!
Get step-by-step solutions from verified subject matter experts
Step: 2 Unlock
Step: 3 Unlock