

Question: using matlab 4. Evaluation Details: Use the monthly mean temperatures for Norfolk for years from 1874 to 2018 contained in the file NorfolkMonMean Temp.dat. The
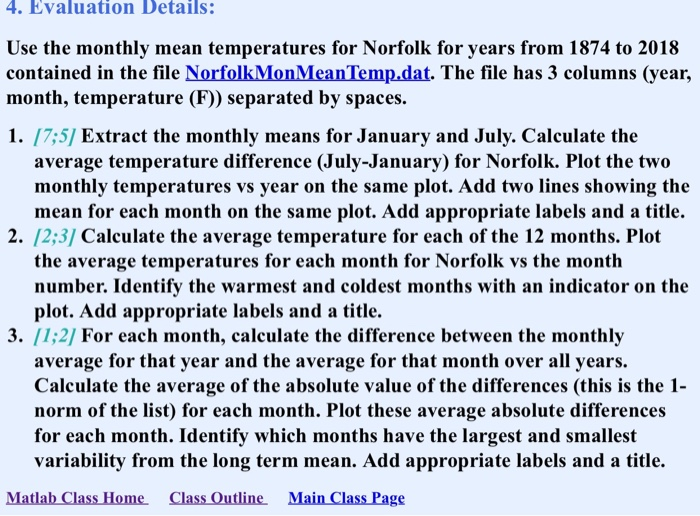
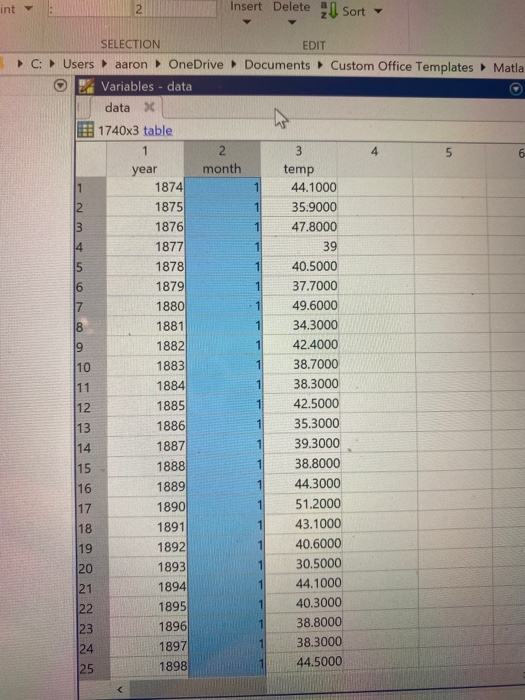
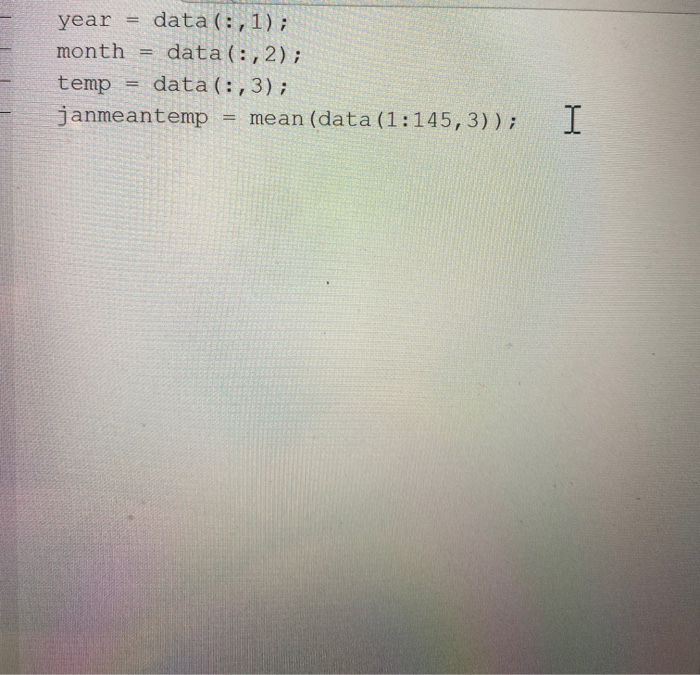
4. Evaluation Details: Use the monthly mean temperatures for Norfolk for years from 1874 to 2018 contained in the file NorfolkMonMean Temp.dat. The file has 3 columns (year, month, temperature (F)) separated by spaces. 1. [7;5/ Extract the monthly means for January and July. Calculate the average temperature difference (July-January) for Norfolk. Plot the two monthly temperatures vs year on the same plot. Add two lines showing the mean for each month on the same plot. Add appropriate labels and a title. 2. 12;3] Calculate the average temperature for each of the 12 months. Plot the average temperatures for each month for Norfolk vs the month number. Identify the warmest and coldest months with an indicator on the plot. Add appropriate labels and a title. 3. [1:2] For each month, calculate the difference between the monthly average for that year and the average for that month over all years. Calculate the average of the absolute value of the differences (this is the 1- norm of the list) for each month. Plot these average absolute differences for each month. Identify which months have the largest and smallest variability from the long term mean. Add appropriate labels and a title. Matlab Class Home Class Outline Main Class Page Insert Delete | Sort C: EDIT Documents Custom Office Templates Matla SELECTION Users aaron OneDrive E Variables - data data X 11740x3 table month year 1874 1875 1876 1877 1878 1879 1880 1881 1882 1883 1884 1885 temp 44.1000 35.9000 47.8000 39 40.5000 37.7000 49.6000 34.3000 42.4000 38.7000 38.3000 42.5000 35.3000 39.3000 38.8000 44.3000 51.2000 43.1000 40.6000 30.5000 44.1000 40.3000 38.8000 38.3000 44.5000 1886 1887 1888 1889 1890 1891 1892 1893 1894 1895 1896 1897 1898 year = data (:,1); month = data(:,2); temp = data (:,3); janmeantemp = mean (data (1:145,3)); 4. Evaluation Details: Use the monthly mean temperatures for Norfolk for years from 1874 to 2018 contained in the file NorfolkMonMean Temp.dat. The file has 3 columns (year, month, temperature (F)) separated by spaces. 1. [7;5/ Extract the monthly means for January and July. Calculate the average temperature difference (July-January) for Norfolk. Plot the two monthly temperatures vs year on the same plot. Add two lines showing the mean for each month on the same plot. Add appropriate labels and a title. 2. 12;3] Calculate the average temperature for each of the 12 months. Plot the average temperatures for each month for Norfolk vs the month number. Identify the warmest and coldest months with an indicator on the plot. Add appropriate labels and a title. 3. [1:2] For each month, calculate the difference between the monthly average for that year and the average for that month over all years. Calculate the average of the absolute value of the differences (this is the 1- norm of the list) for each month. Plot these average absolute differences for each month. Identify which months have the largest and smallest variability from the long term mean. Add appropriate labels and a title. Matlab Class Home Class Outline Main Class Page Insert Delete | Sort C: EDIT Documents Custom Office Templates Matla SELECTION Users aaron OneDrive E Variables - data data X 11740x3 table month year 1874 1875 1876 1877 1878 1879 1880 1881 1882 1883 1884 1885 temp 44.1000 35.9000 47.8000 39 40.5000 37.7000 49.6000 34.3000 42.4000 38.7000 38.3000 42.5000 35.3000 39.3000 38.8000 44.3000 51.2000 43.1000 40.6000 30.5000 44.1000 40.3000 38.8000 38.3000 44.5000 1886 1887 1888 1889 1890 1891 1892 1893 1894 1895 1896 1897 1898 year = data (:,1); month = data(:,2); temp = data (:,3); janmeantemp = mean (data (1:145,3))
Step by Step Solution
There are 3 Steps involved in it

Get step-by-step solutions from verified subject matter experts