

Question: Using matlab, complete the code (1)Lowpass (2)Highpass (3)bandpass filters and compare the results in both time and frequency domains. display the signal of audio in
Using matlab, complete the code (1)Lowpass (2)Highpass (3)bandpass filters and compare the results in both time and frequency domains. display the signal of audio in the time domain and frequency domain. use 160000 samples from audio file (fs : 48000)
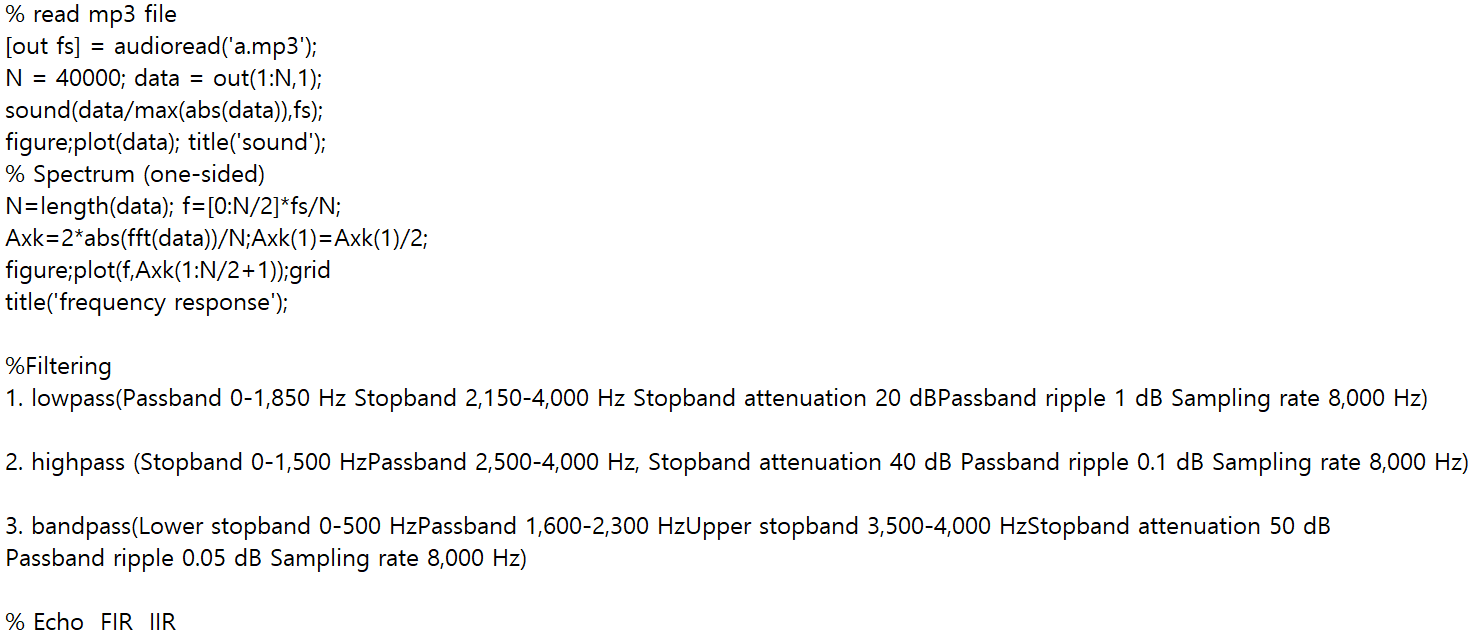
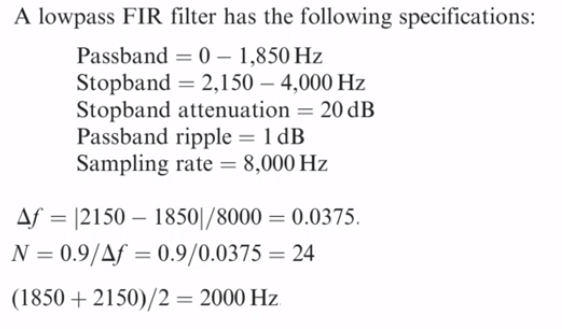
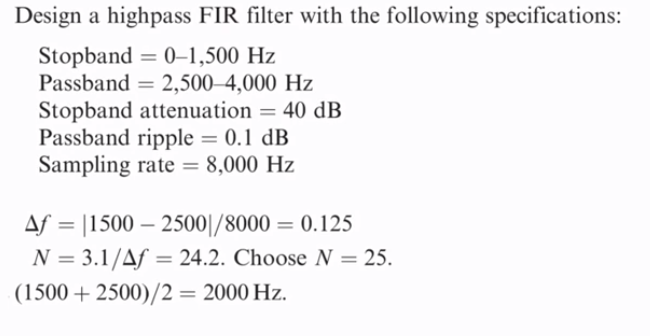
% read mp3 file [out fs] = audioread('a.mp3'); N = 40000; data = out(1:N, 1); sound(data/max(abs(data)),fs); figure;plot(data); title('sound'); % Spectrum (one-sided) N=length(data); f=[O:N/2]*fs/N; Axk=2*abs(fft(data))/N;Axk(1)=Axk(1)/2; figure;plot(f,Axk(1:N/2+1));grid title('frequency response'); %Filtering 1. lowpass(Passband 0-1,850 Hz Stopband 2,150-4,000 Hz Stopband attenuation 20 dBPassband ripple 1 dB Sampling rate 8,000 Hz) 2. highpass (Stopband 0-1,500 HzPassband 2,500-4,000 Hz, Stopband attenuation 40 dB Passband ripple 0.1 dB Sampling rate 8,000 3. bandpass(Lower stopband 0-500 HzPassband 1,600-2,300 HzUpper stopband 3,500-4,000 HzStopband attenuation 50 dB Passband ripple 0.05 dB Sampling rate 8,000 Hz) % Echo FIR IIR A lowpass FIR filter has the following specifications: Passband = 0) 1,850 Hz Stopband = 2,150 4,000 Hz Stopband attenuation = 20 dB Passband ripple = 1dB Sampling rate = 8,000 Hz Af = |2150 - 1850/8000 = 0.0375. N = 0.9/Af = 0.9/0.0375 = 24 (1850 + 2150)/2 = 2000 Hz Design a highpass FIR filter with the following specifications: Stopband = 0-1,500 Hz Passband = 2,500 4,000 Hz Stopband attenuation = 40 dB Passband ripple = 0.1 dB Sampling rate = 8,000 Hz Af = 1500 25001/8000 = 0.125 N = 3.1/Af = 24.2. Choose N = 25. (1500 + 2500)/2 = 2000 Hz. % read mp3 file [out fs] = audioread('a.mp3'); N = 40000; data = out(1:N, 1); sound(data/max(abs(data)),fs); figure;plot(data); title('sound'); % Spectrum (one-sided) N=length(data); f=[O:N/2]*fs/N; Axk=2*abs(fft(data))/N;Axk(1)=Axk(1)/2; figure;plot(f,Axk(1:N/2+1));grid title('frequency response'); %Filtering 1. lowpass(Passband 0-1,850 Hz Stopband 2,150-4,000 Hz Stopband attenuation 20 dBPassband ripple 1 dB Sampling rate 8,000 Hz) 2. highpass (Stopband 0-1,500 HzPassband 2,500-4,000 Hz, Stopband attenuation 40 dB Passband ripple 0.1 dB Sampling rate 8,000 3. bandpass(Lower stopband 0-500 HzPassband 1,600-2,300 HzUpper stopband 3,500-4,000 HzStopband attenuation 50 dB Passband ripple 0.05 dB Sampling rate 8,000 Hz) % Echo FIR IIR A lowpass FIR filter has the following specifications: Passband = 0) 1,850 Hz Stopband = 2,150 4,000 Hz Stopband attenuation = 20 dB Passband ripple = 1dB Sampling rate = 8,000 Hz Af = |2150 - 1850/8000 = 0.0375. N = 0.9/Af = 0.9/0.0375 = 24 (1850 + 2150)/2 = 2000 Hz Design a highpass FIR filter with the following specifications: Stopband = 0-1,500 Hz Passband = 2,500 4,000 Hz Stopband attenuation = 40 dB Passband ripple = 0.1 dB Sampling rate = 8,000 Hz Af = 1500 25001/8000 = 0.125 N = 3.1/Af = 24.2. Choose N = 25. (1500 + 2500)/2 = 2000 Hz
Step by Step Solution
There are 3 Steps involved in it

Get step-by-step solutions from verified subject matter experts