

Question: Using MATLAB Consider the 3 - phase excitation: v a = Acos ( t ) V , v b = Acos ( t - 2
Using MATLAB
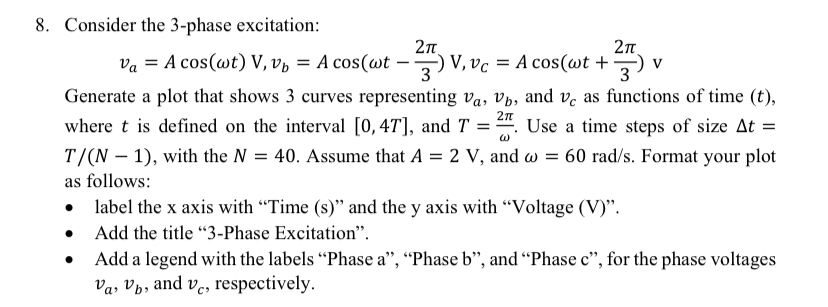
Consider the phase excitation:
AcosAcosAcos
Generate a plot that shows curves representing and as functions of time where is defined on the interval and Use a time steps of size with the Assume that and Format your plot as follows:
label the axis with "Time s and the y axis with "Voltage V
Add the title Phase Excitation".
Add a legend with the labels "Phase a "Phase b and "Phase c for the phase voltages and respectively.
Step by Step Solution
There are 3 Steps involved in it
1 Expert Approved Answer
Step: 1 Unlock

Question Has Been Solved by an Expert!
Get step-by-step solutions from verified subject matter experts
Step: 2 Unlock
Step: 3 Unlock