

Question: Using MATLAB Create a vector x with values of 0 to 10 in steps of 0.5. Given 2xe-0.1x y= x2 +1 a. Create a graph
 Using MATLAB
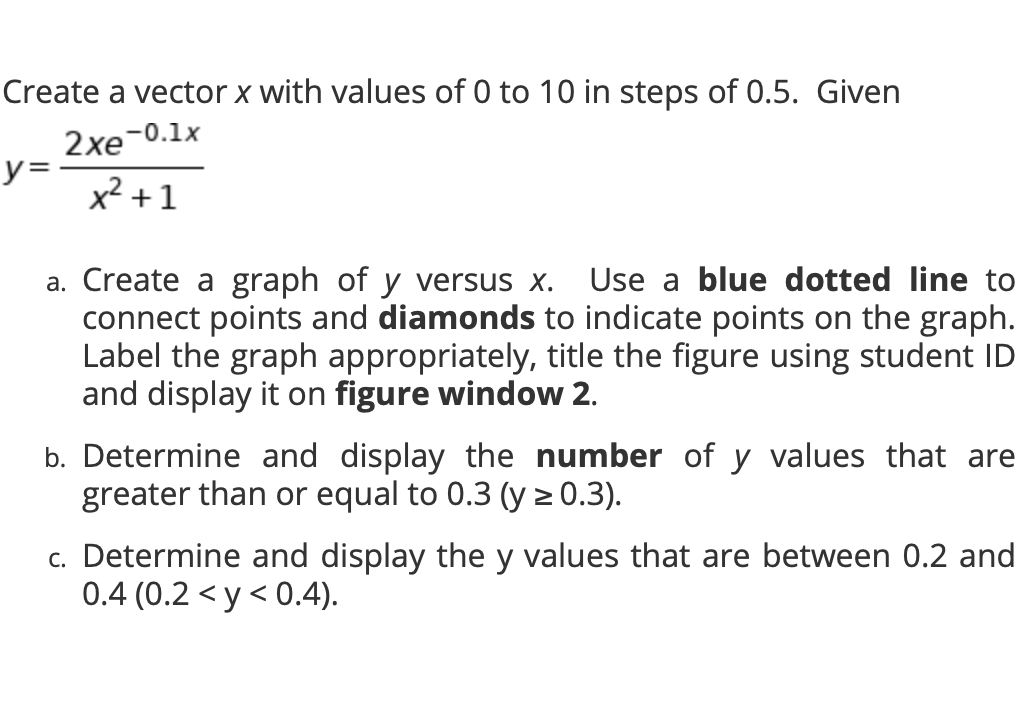
Create a vector x with values of 0 to 10 in steps of 0.5. Given 2xe-0.1x y= x2 +1 a. Create a graph of y versus X. Use a blue dotted line to connect points and diamonds to indicate points on the graph. Label the graph appropriately, title the figure using student ID and display it on figure window 2. b. Determine and display the number of y values that are greater than or equal to 0.3 (y 20.3). c. Determine and display the y values that are between 0.2 and 0.4 (0.2
Step by Step Solution
There are 3 Steps involved in it
1 Expert Approved Answer
Step: 1 Unlock

Question Has Been Solved by an Expert!
Get step-by-step solutions from verified subject matter experts
Step: 2 Unlock
Step: 3 Unlock