

Question: using matlab Exercise 5.1. Let f (x, y)-2x +xyy. Write an M-file that uses subplot to generate a 1 x 2 array of plots with
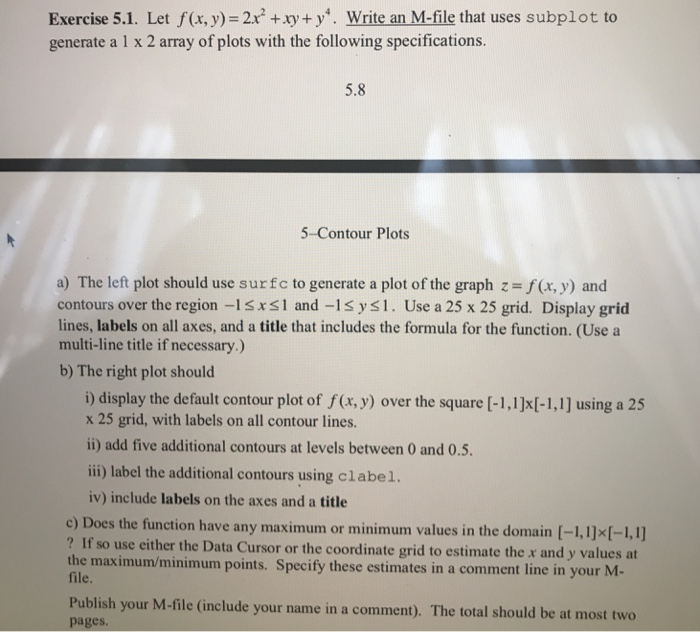
Exercise 5.1. Let f (x, y)-2x +xyy. Write an M-file that uses subplot to generate a 1 x 2 array of plots with the following specifications. 5.8 5-Contour Plots a) The left plot should use surf c to generate a plot of the graph z =f(x,y) and contours over the region -1sxsl and-1s ysl. Use a 25 x 25 grid. Display grid lines, labels on all axes, and a title that includes the formula for the function. (Use a multi-line title if necessary.) b) The right plot should i) display the default contour plot of f(x, y) over the square [-1,1]xl-1,1] using a 25 x 25 grid, with labels on all contour lines. ii) add five additional contours at levels between 0 and 0.5 ii) label the additional contours using clabel. iv) include labels on the axes and a title c) Does the function have any maximum or minimum values in the domain [-1,1]x[-1,1] ? If so use either the Data Cursor or the coordinate grid to estimate the x and y values at the file. maximum/minimum points. Specify these estimates in a comment line in your M- Publish your M-file (include your name in a comment). The total should be at most two pages
Step by Step Solution
There are 3 Steps involved in it

Get step-by-step solutions from verified subject matter experts