

Question: Using MATLAB, plot the function f ( x 1 , x 2 ) = 2 x 1 3 x 2 2 + x 1 2
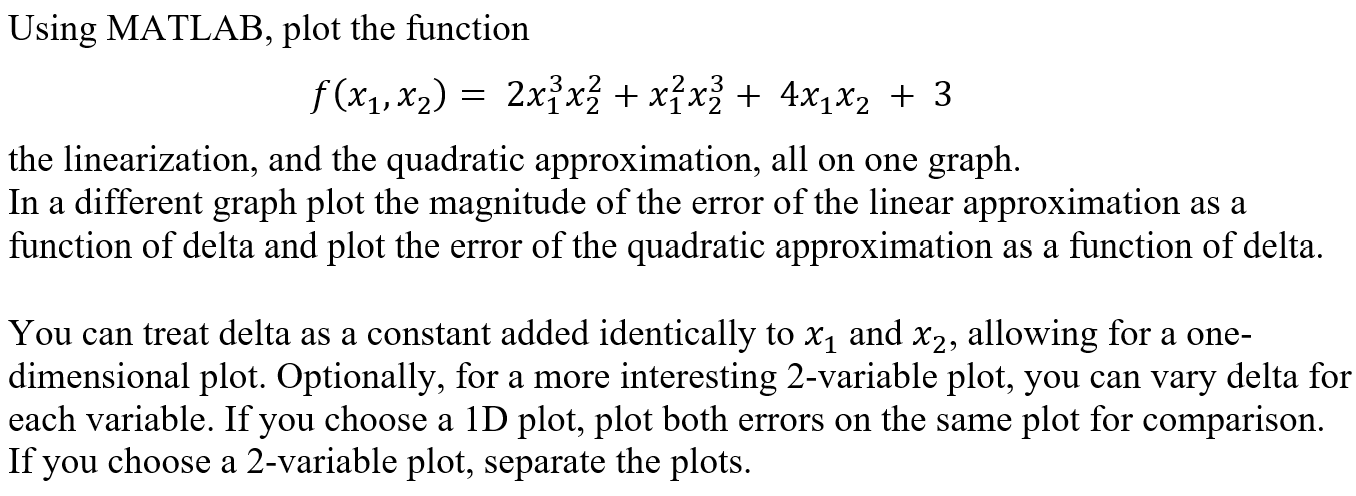
Using MATLAB, plot the function
the linearization, and the quadratic approximation, all on one graph.
In a different graph plot the magnitude of the error of the linear approximation as a
function of delta and plot the error of the quadratic approximation as a function of delta.
You can treat delta as a constant added identically to and allowing for a one
dimensional plot. Optionally, for a more interesting variable plot, you can vary delta for
each variable. If you choose a D plot, plot both errors on the same plot for comparison.
If you choose a variable plot, separate the plots.
Step by Step Solution
There are 3 Steps involved in it
1 Expert Approved Answer
Step: 1 Unlock

Question Has Been Solved by an Expert!
Get step-by-step solutions from verified subject matter experts
Step: 2 Unlock
Step: 3 Unlock