

Question: Using Matlab Problem #7: Surface and mesh plots in 3D - using the following equation generate a mesh/contour plot and surface/contour plot for the given
Using Matlab
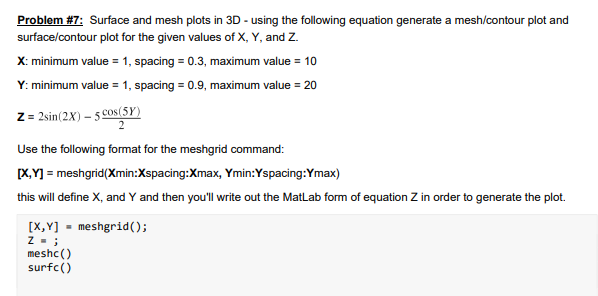
Problem #7: Surface and mesh plots in 3D - using the following equation generate a mesh/contour plot and surface/contour plot for the given values of X, Y, and Z. X: minimum value = 1, spacing = 0.3, maximum value = 10 Y: minimum value = 1, spacing = 0.9, maximum value = 20 z = 2sin(2x) - 5 cos(5Y) Use the following format for the meshgrid command: [X,Y] = meshgrid(Xmin:Xspacing:Xmax, Ymin:Yspacing:Ymax) this will define Xand Y and then you'll write out the Matlab form of equation Z in order to generate the plot. [X,Y] - meshgrid(); meshc() surfc() Z=
Step by Step Solution
There are 3 Steps involved in it
1 Expert Approved Answer
Step: 1 Unlock

Question Has Been Solved by an Expert!
Get step-by-step solutions from verified subject matter experts
Step: 2 Unlock
Step: 3 Unlock