

Question: Using Matlab Write a function plot_piecewise (funcs) to plot a piecewise function f(x). Your function should take ONE input, funcs, which is a cell array
 Using Matlab
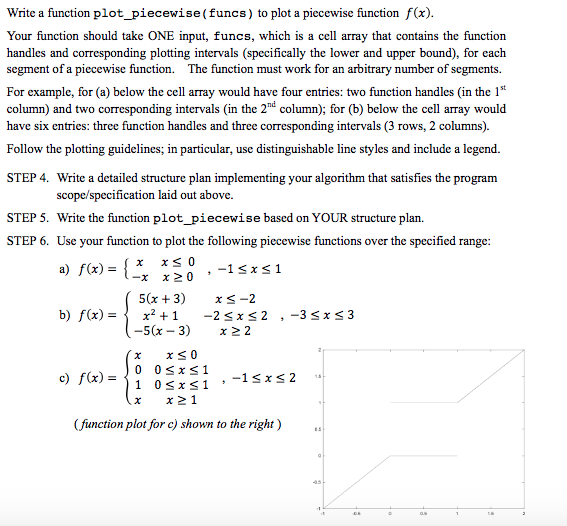
Write a function plot_piecewise (funcs) to plot a piecewise function f(x). Your function should take ONE input, funcs, which is a cell array that contains the function handles and corresponding plotting intervals (specifically the lower and upper bound), for each segment of a piecewise function. The function must work for an arbitrary' number of segments. For example, for (a) below the cell array would have four entries: two function handles (in the 1st column) and two corresponding intervals (in the 2nd column); for (b) below the cell array would have six entries: three function handles and three corresponding intervals (3 rows, 2 columns). Follow the plotting guidelines; in particular, use distinguishable line styles and include a legend. Write a detailed structure plan implementing your algorithm that satisfies the program scope/specification laid out above. Write the function plot_piecewise based on YOUR structure plan. Use your function to plot the following piecewise functions over the specified range: a) f(x) = {x x lessthanorequalto 0 -x x greaterthanorequalto 0, -1 lessthanorequalto x lessthanorequalto 1 b) f(x) = {5(x + 3) x lessthanorequalto -2, x^2 + 1 -2 lessthanorequalto x lessthanorequalto 2, -3 lessthanorequalto x lessthanorequalto 3 -5 (x - 3) x greaterthanorequalto 2 c) f(x) = {x x lessthanorequalto 0 0 0 lessthanorequalto x lessthanorequalto 1, -1 lessthanorequalto x lessthanorequalto 2 1 0 lessthanorequalto x lessthanorequalto 1 x x greaterthanorequalto 1 (function plot for c) shown to the right)
Step by Step Solution
There are 3 Steps involved in it

Get step-by-step solutions from verified subject matter experts