

Question: using python Let us consider 1000 voters. Each voter votes yes or no on Proposition X. In this exercise we shall see the fluctuation of
using python
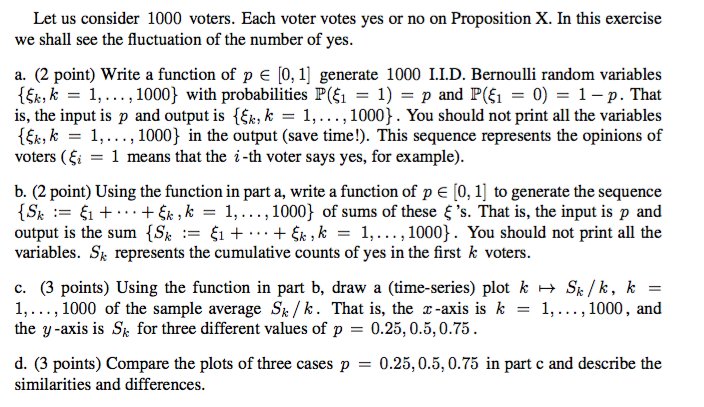
Let us consider 1000 voters. Each voter votes yes or no on Proposition X. In this exercise we shall see the fluctuation of the number of yes a. (2 point) Write a function of p E [0,1] generate 1000 II.D. Bernoulli random variables ,k = 1, , 10001 with probabilities P. = 1) = p and P(fi = 0) = 1-p. That is, the input is p and output is , k 1, . . . , 1000} . You should not print all the variables k, k = 1, . . . , 1000} in the output (save time!). This sequence represents the opinions of voters ( = 1 means that the i-th voter says yes, for example) b. (2 point) Using the function in part a, write a function of p e [0, 1] to generate the sequence (Sk := | + . . . + Se , k = 1, . . . , 10001 of sums of these 's. That is, the input is p and output is the sum {Sk := 1 + . . . + Se , k = 1, . . . , 10001 . You should not print all the variables. Sk represents the cumulative counts of yes in the first k voters. C. (3 points) Using the function in part b, draw a (time-series) plot k-Sk/k, k 1, . . . , 1000 of the sample average Sk / k . That is, the x-axis is k = 1, 1000, and the y-axis is Sk for three different values of p = 0.25, 0.5, 0.75 d. (3 points) Compare the plots of three cases p = 0.25, 0.5, 0.75 in part c and describe the similarities and differences
Step by Step Solution
There are 3 Steps involved in it

Get step-by-step solutions from verified subject matter experts