

Question: Using PYTHON : Plot the log10 of the deviation from Q=1.0 as a function of the log10 of the number of values N = 1-,
Using PYTHON: Plot the log10 of the deviation from Q=1.0 as a function of the log10 of the number of values N = 1-, 100, 10000 (Must by able to read over thousands of random numbers from File IO given by user imput)
Here are the first 10 random numbers put on file that can be tested (DataSet1.dat):
9.8254457980e-1
1.0293906530e+0
8.6314178340e-1
8.7754757930e-1
8.2216021950e-1
9.8155318390e-1
1.0215753050e+0
1.0064994180e+0
1.0300426240e+0
8.7195144970e-1
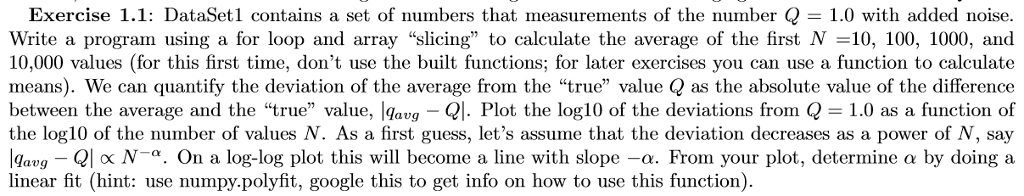
Exercise 1.1: DataSetl contains a set of numbers that measurements of the number 1.0 with added noise Write a program using a for loop and array "slicing" to calculate the average of the first N-10, 100, 1000, and 10,000 values (for this first time, don't use the built functions; for later exercises you can use a function to calculate means). We can quantify the deviation of the average from the "true" value Q as the absolute value of the difference between the average and the "true" value, llavg -Ql. Plot the log10 of the deviations from Q 1.0 as a function of the log10 of the number of values M. As a first guess, let's assume that the deviation decreases as a power of X, say Yat g Q x N . On a log-log plot this will become a line with slope a. Fron your plot, determine by doing a avg linear fit (hint: use numpy.polyfit, google this to get info on how to use this function) Exercise 1.1: DataSetl contains a set of numbers that measurements of the number 1.0 with added noise Write a program using a for loop and array "slicing" to calculate the average of the first N-10, 100, 1000, and 10,000 values (for this first time, don't use the built functions; for later exercises you can use a function to calculate means). We can quantify the deviation of the average from the "true" value Q as the absolute value of the difference between the average and the "true" value, llavg -Ql. Plot the log10 of the deviations from Q 1.0 as a function of the log10 of the number of values M. As a first guess, let's assume that the deviation decreases as a power of X, say Yat g Q x N . On a log-log plot this will become a line with slope a. Fron your plot, determine by doing a avg linear fit (hint: use numpy.polyfit, google this to get info on how to use this function)
Step by Step Solution
There are 3 Steps involved in it

Get step-by-step solutions from verified subject matter experts