

Question: Using R. The questions you will have to answer are as follows: 1. Which app is popular. Provide a ranking of the apps as a
Using R. The questions you will have to answer are as follows:
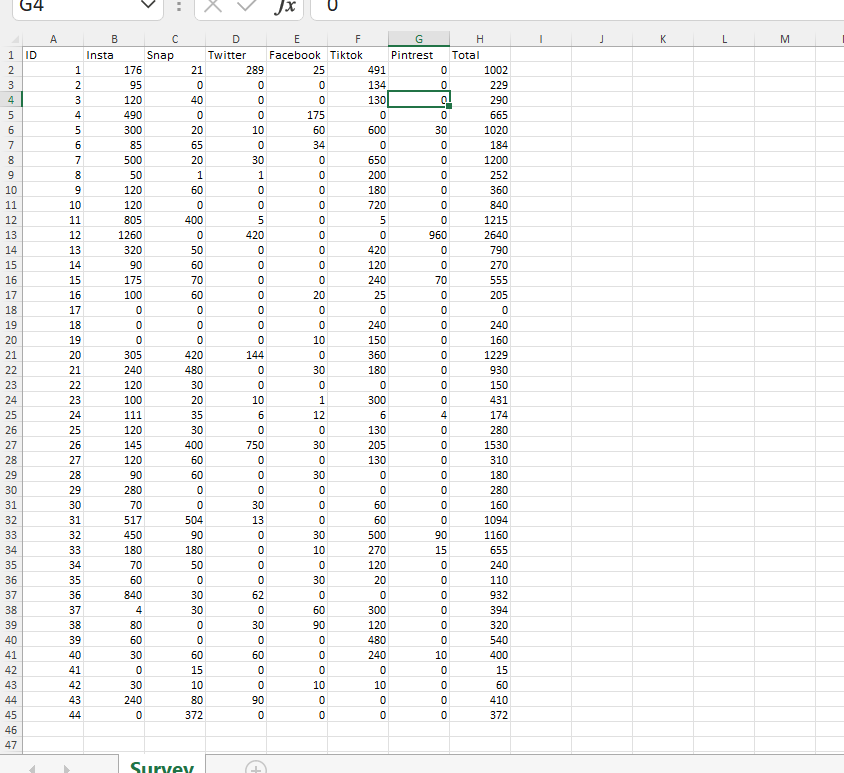
1. Which app is "popular". Provide a ranking of the apps as a table and a chart.
2) Provide the Mean and Standard Deviation for each app.
3) Show Box Plot for each app. Extra points if you can show the box plots in one chart
4) Show what your Z score and the p-value for the corresponding Z score is for each app. I am hoping you remember what your survey answer were. If not, let me know and I will send out a lookup key. I did not want to show emails and responses to protect anonymity.
5) Predict what the population mean and the range each app based on the responses. Chose 90% as the confidence interval.
Step by Step Solution
There are 3 Steps involved in it

Get step-by-step solutions from verified subject matter experts