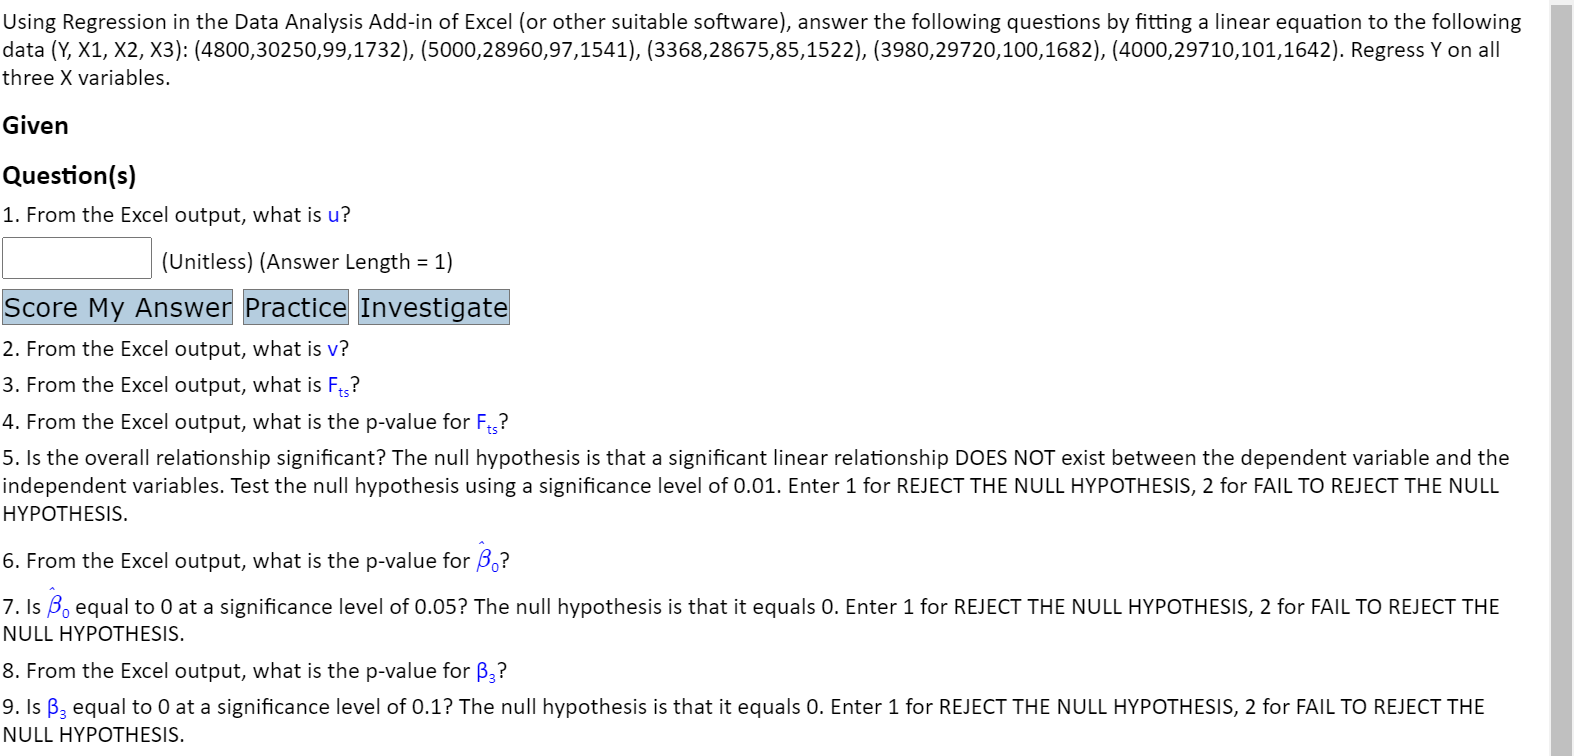
Question: Using Regression in the Data Analysis Add-in of Excel (or other suitable software), answer the following questions by fitting a linear equation to the following

Using Regression in the Data Analysis Add-in of

Using Regression in the Data Analysis Add-in of Excel (or other suitable software), answer the following questions by fitting a linear equation to the following data (Y, X1, X2, X3): (4800,30250,99,1732), (5000,28960,97,1541), (3368,28675,85,1522), (3980,29720,100,1682), (4000,29710,101,1642). Regress Y on all three X variables. Given Question(s) 1. From the Excel output, what is u? (Unitless) (Answer Length = 1) Score My Answer Practice Investigate 2. From the Excel output, what is v? 3. From the Excel output, what is Fts? 4. From the Excel output, what is the p-value for Fts? 5. Is the overall relationship significant? The null hypothesis is that a significant linear relationship DOES NOT exist between the dependent variable and the independent variables. Test the null hypothesis using a significance level of 0.01. Enter 1 for REJECT THE NULL HYPOTHESIS, 2 for FAIL TO REJECT THE NULL HYPOTHESIS. 6. From the Excel output, what is the p-value for B.? 7. Is B. equal to 0 at a significance level of 0.05? The null hypothesis is that it equals 0. Enter 1 for REJECT THE NULL HYPOTHESIS, 2 for FAIL TO REJECT THE NULL HYPOTHESIS. 8. From the Excel output, what is the p-value for B3? 9. Is B, equal to 0 at a significance level of 0.1? The null hypothesis is that it equals 0. Enter 1 for REJECT THE NULL HYPOTHESIS, 2 for FAIL TO REJECT THE NULL HYPOTHESIS

Step by Step Solution

There are 3 Steps involved in it

1 Expert Approved Answer
Step: 1 Unlock blur-text-image
Question Has Been Solved by an Expert!

Get step-by-step solutions from verified subject matter experts

Step: 2 Unlock
Step: 3 Unlock

Students Have Also Explored These Related General Management Questions!