

Question: Using Table 1 calculate and interpret the odds ratio for the association between gender of children (boys versus girls) and diabetes (yes versus no) .
Using Table 1 calculate and interpret the odds ratio for the association between gender of children (boys versus girls) and diabetes (yes versus no) .
Please show all work and include 2*2 table.
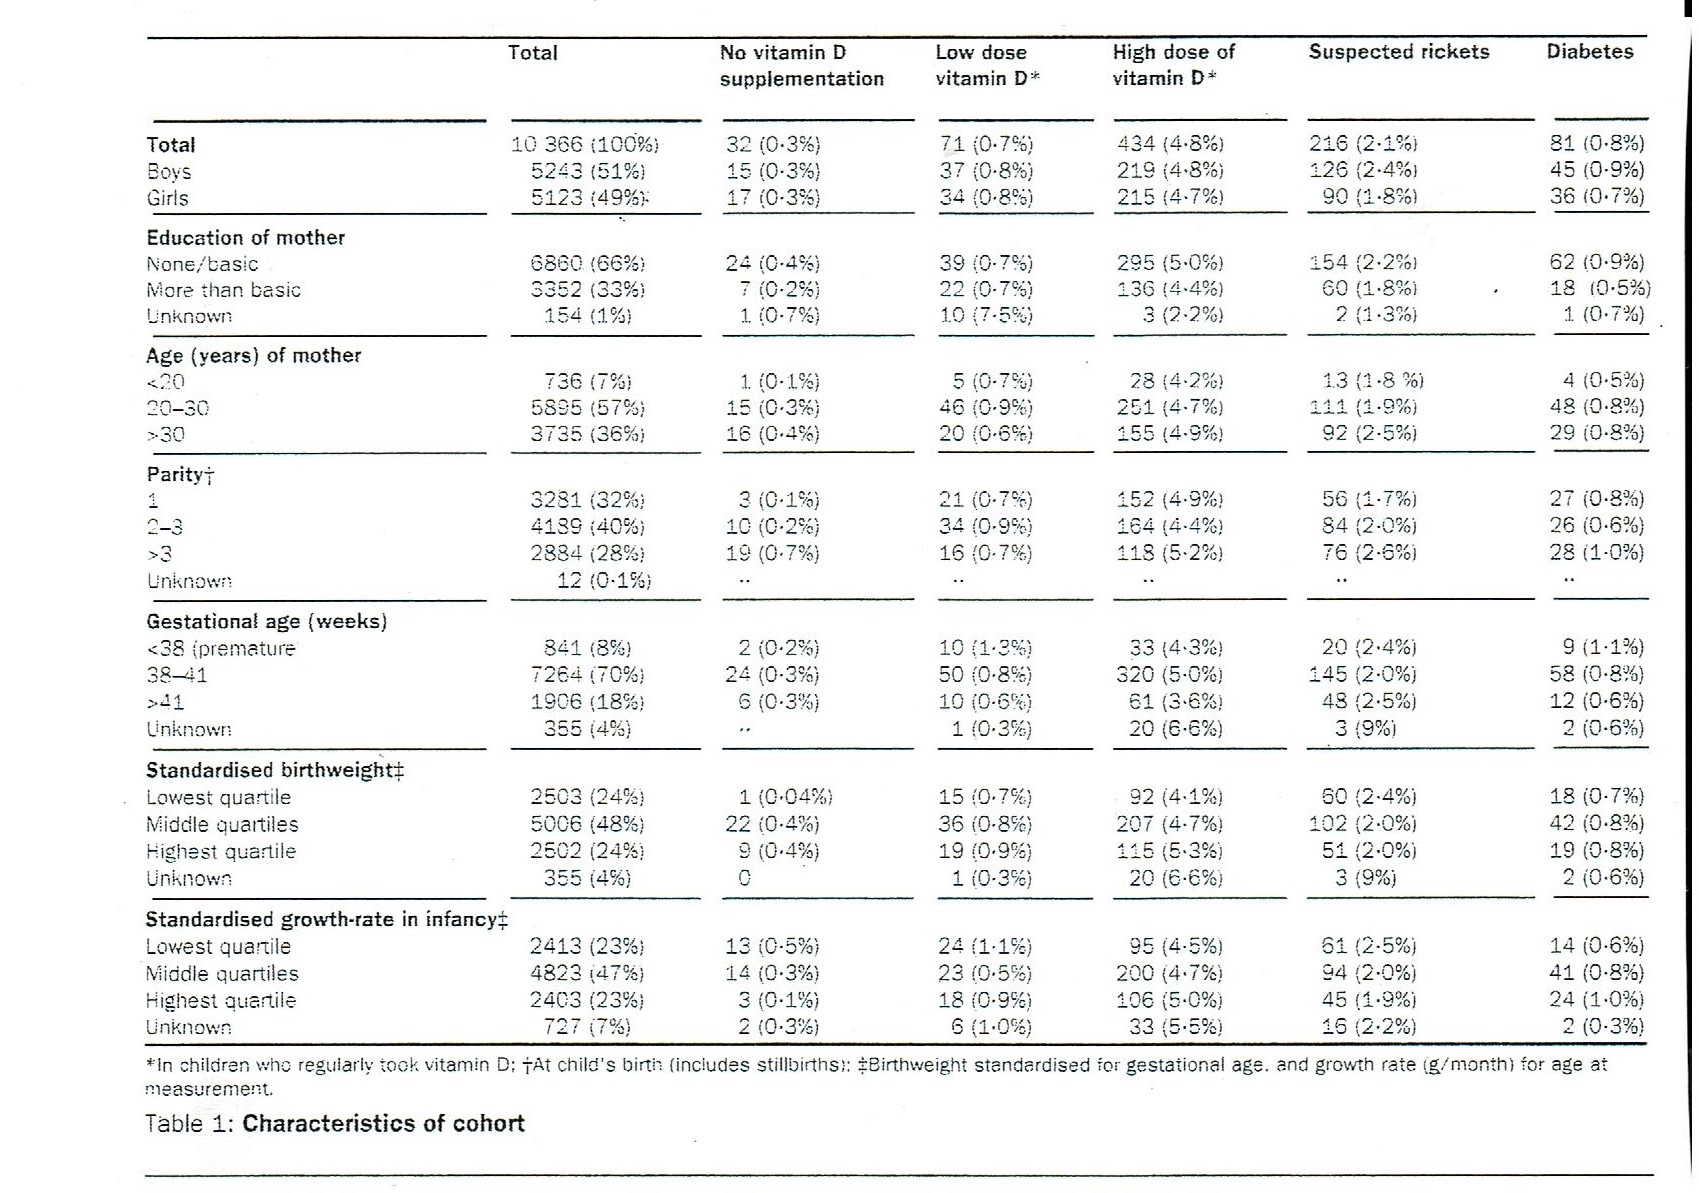
Total Yo vitamin D. LOW dose* High dose of Suspected rickets Diabetes supplementation vitamin D :* vitamin D * Total IC 360 1 10 0 %'; 32 10 . 3% ) 71 10 . 7 %" $34 1 4 . 890) 216 12 . 1 30) 81 10 . 830 ) EON'S 5243 151%6} 1 5. 10 . 3%) 37 10 . 8%) 219 1 4 . 8%0; :26 12 . 4901) 45 10 . 930) Girls 5123 : 49 95 ;^ 1 7 10 . 3%/}} 34 10 . 8 %} 215 1 4 . 7%{ ! 90 1 1 . 830 ) 36 10 . 7%/6 ) Education of mother NONE ; Kasic 2 4 10 . 4%/} 3810 . 7 %) 295 15 . 09' : 54 1 2 . 230 1) 62 10 . 970) vore than basic 6:352 13:395} ? 10 . 2%) 22 10 - 7^) $ 30 1 4 . 490 ) 60 ( 1 . 830) 18 10 . 53/5 ) Linknow't ; 15 4 ( 1 9}} 1. 10 . 7% ) 1.01 7. 5^ 3 12 .2 %) 2 ( 1 . 3701) 1. ( 0 . 7%) Age ( years ; of mother . 36 17 9` 1 . 10 - 1. 92} 5 10 - ? ^ 28 1 4 . 2%6) 1.3 1 2 . 8 3 0) 4 10 . 53/5) 20 - 30 5895 1579} 15 10 . 3^ 46 10 . 39} 25 1 1 4 . 7% !` 48 1 0 . 8%) : 30 37 35 136% } 16 1 0 . 4%/} 20 1 0 . 3^ $ 5 5 1 4 . 5% !) 92 12 . 5%} 20 10 . 835) Parity'T 3281 1329} 3. 10 . 1%} 21 10. 7 9^) $ 5 2 1 4 . 93/6) 56 1 1 . 7 %) 27 10 . 8 30 ) 2 - 3 $139 140%; 10 10 . 23/} 34 10 . 5^ $ 6 4 1 4 . 4%) 84 12 . 0190) 26 10 . 5%0) 283 4 1289} } 19 ( 0 . 7%} 15 1 0 . 7 9}) $18 1 5 . 2% !) 76 12 . 5%0| 28 1 1 . 0236 ) 12 1 0 . 196} Gestational age ( weeks ) _ 3 8 ipremature 841 18%6 ) 210 . 23/} 10 1 1 . 2 9^ 33 14 . 386) 20 12 . 4%0) 9/1 . 1%6 ) 38 _$1 2 4 10 . 3%} 5010 . 8 9} 320 15 - 0%0 !\\ $ 45 12 .0 %6} 58 10 . 8%) = 41 190 6 1 1895 !) 51 0 . 3^ 10 10. 5^ $ 1 13 . 6% ! 48 12 . 5%101 12 10 . 5 %5 ) Linkinown ! 355 1 49') 1 1 0 . 39/}) 20 1 6 . 6 %! 3 1 9 90') 2 10 . 6 %) Standardised birthweight- Lowest quartile* 25.03 12495 ) 1 10 . 04%` 15:0. 79} 92 1 4 . 1%) 50 1 2 . 4%6) 18 10 . 7% ) Middle quartiles ZOCE 148% } 2210 . 43/}} 36 10 . 89/6) 207 (4 . 7%6 !) 102 12 . 09} 42 10 . 83/5) `ishast quartile* 2 5.0 2 124%/}} $ 10 . 4%/} 19 1 0 . 9 95) $1 5 1 5 . 396) 51 / 2 . 2%) 19 10 . 83/6) 355 1 4% !) 1 10 . 390) 20 18 . 6 %) 3 1 9 90 ) 2 10 . 6 %0) O Linknows Standardised growth-rate in infancyt Lovrest quartile* 2413 123%/2) 13 10 . 5 %/} 2 4 ( 1 . 195) 95 14 . 5%) $1 12 . 5%) 14 10 . 6%0) Middle quartiles* 4823 14 7 9/6) 14 10 . 3%/} 2310 . 5 %/6) 200 14 . 7%/0 ! 94 12 . 090) 41 10 . 8%6) Highest quartile* 240:3 123%/}} 3 1 0 . 1%} 18 10 . 99/6) : 06 15 . 0 90!) 45 1 1 . 9 96) 24 1 1 . 0 3 6 ! LIMKNOWE :` 727 17` ! 210. 3%/} $ 1 1 . 09^ ^ 33 1 5 . 5%2 ) 15 12 . 2%6) 2 10 . 3 7/0 ! * In children who regularly, jock vitamin D : TAt child's birth : (includes stillbirths * : $ Birthweight standardised for gestational age . and growth rate is ' month ; for age at measurement . Table 1 : Characteristics of cohort
Step by Step Solution
There are 3 Steps involved in it

Get step-by-step solutions from verified subject matter experts