

Question: Using Table 5.3 as your guide. (All returns in this problem are in annual term.) Estimate the Sharpe Ratio of the stock market portfolio and
Using Table 5.3 as your guide. (All returns in this problem are in annual term.)
Estimate the Sharpe Ratio of the stock market portfolio and the Sharpe Ratio of the T-Bonds.
Hints:
Assume that market risk premium and market volatility are constant over time. The same for T-Bonds.
(Present your results as decimals, not percentages. Round your answer to 2 decimal places.)
Market Sharpe Ratio?
T-bond Sharpe Ratio?
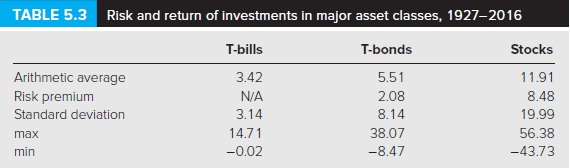
TABLE 5.3 Risk and return of investments in major asset classes, 1927-2016 T-bills T-bonds Stocks Arithmetic average 3.42 5.51 11.91 Risk premium N/A 2.08 8.48 Standard deviation 3.14 8.14 19.99 14.71 38.07 56.38 min -0.02 -8.47 -43.73 max
Step by Step Solution
There are 3 Steps involved in it

Get step-by-step solutions from verified subject matter experts