

Question: Using the A2 value (from the table), determine the lower control limit for (X-Bar) Control Chart. Round to 4 decimal places. Determine the upper control
Using the A2 value (from the table), determine the lower control limit for (X-Bar) Control Chart. Round to 4 decimal places.
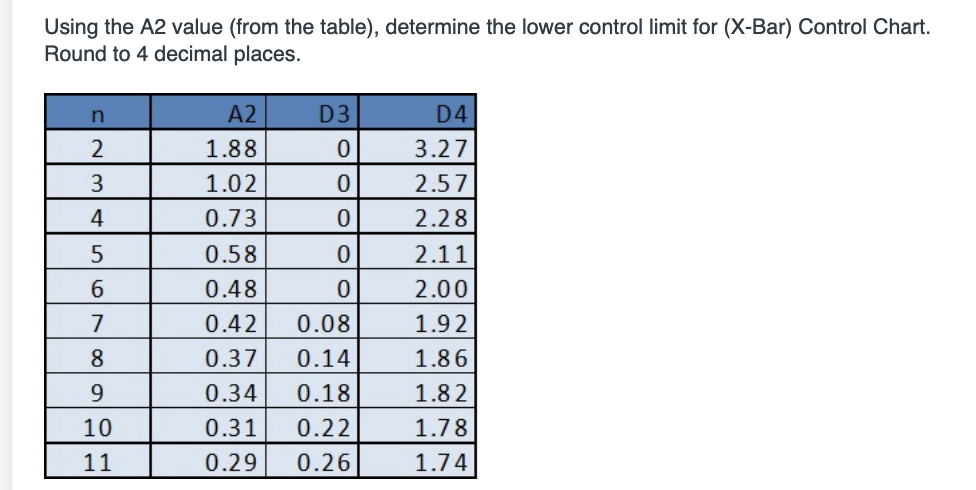
Determine the upper control limit for (X-Bar) Control Chart. Round to 4 decimal places.
Using the D3 value, determine the lower control limit for Range (R) control chart.
Using the D4 value, determine the upper control limit for Range (R) control chart. Round to 4 decimal places.
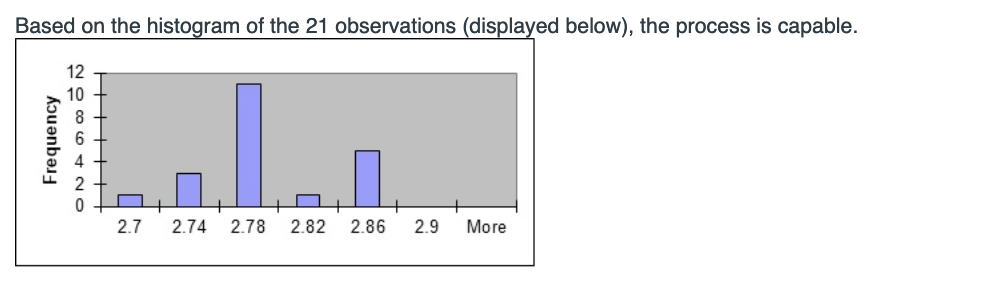
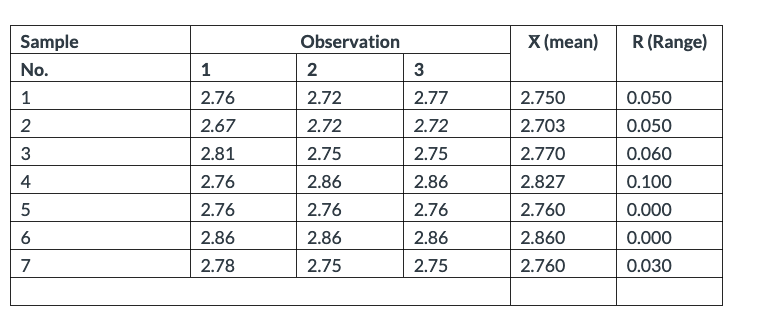
What is the CPk? [Note that X-Double bar is also the overall average; mean of all 21 observations. Round to 4 decimal places.
Step by Step Solution
There are 3 Steps involved in it
1 Expert Approved Answer
Step: 1 Unlock

Question Has Been Solved by an Expert!
Get step-by-step solutions from verified subject matter experts
Step: 2 Unlock
Step: 3 Unlock