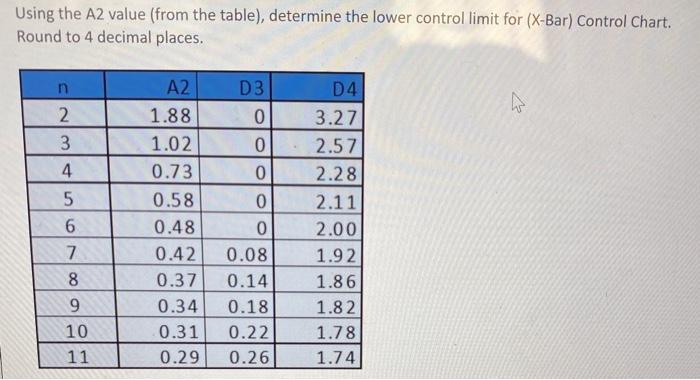
Question: Using the A2 value (from the table), determine the lower control limit for (X-Bar) Control Chart. Round to 4 decimal places. h n 2 3

Using the A2 value (from the table), determine
Using the A2 value (from the table), determine the lower control limit for (X-Bar) Control Chart. Round to 4 decimal places. h n 2 3 4. 3 5 6 7 8 9 10 11 A2 1.88 1.02 0.73 0.58 0.48 0.42 0.37 0.34 0.31 0.29 D3 0 0 0 0 0 0.08 0.14 0.18 0.22 0.26 D4 3.27 2.57 2.28 2.11 2.00 1.92 1.86 1.82 1.78 1.74 Consider 355 milli-liter (ml) bottles of Stroh beer. The CO2 content in a bottle is specified by the brew master to be at least 250 ml. Sever samples of 3 bottles each were collected from the bottling process, and their CO2 content (in ml) was measured: [Note: there is only one specification limit.] Ximean) R(Range) 1 Sample No. 1 2 3 4 276 267 2.81 Observation 2 3 2.72 2.77 2.72 2.72 2.75 2.75 286 286 2.76 2.76 286 2.86 275 2.75 2.750 2703 2.770 2827 2760 2860 2.760 2.76 276 286 2.78 0.050 0.050 0.060 0.100 0.000 0.000 0.030 5 6 7 The standard deviation of the above 21 observations is 0.0553 mi The above information applies to questions 1-10. What is the mean of means X double bar)? Round to 4 decimal places

Step by Step Solution

There are 3 Steps involved in it

1 Expert Approved Answer
Step: 1 Unlock blur-text-image
Question Has Been Solved by an Expert!

Get step-by-step solutions from verified subject matter experts

Step: 2 Unlock
Step: 3 Unlock

Students Have Also Explored These Related General Management Questions!