

Question: Using the A2 value (from the table), determine the lower control limit for (X-Bar) Control Chart. Determine the upper control limit for (X-Bar) Control Chart.
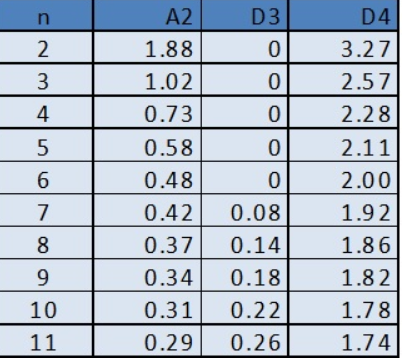
Using the A2 value (from the table), determine the lower control limit for (X-Bar) Control Chart.
Determine the upper control limit for (X-Bar) Control Chart.
Using the D3 value, determine the lower control limit for the Range (R) control chart.
Using the D4 value, determine the upper control limit for the Range (R) control chart.
The process is in control considering both X-Bar and R charts.
True
False
D3 0 0 0 CONOWN 0 A2 1.88 1.02 0.73 0.58 0.48 0.42 0.37 0.34 0.31 0.29 0 D4 3.27 2.57 2.28 2.11 2.00 1.92 1.86 1.82 1.78 1.74 9 10 11 0.08 0.14 0.18 0.22 0.26 D3 0 0 0 CONOWN 0 A2 1.88 1.02 0.73 0.58 0.48 0.42 0.37 0.34 0.31 0.29 0 D4 3.27 2.57 2.28 2.11 2.00 1.92 1.86 1.82 1.78 1.74 9 10 11 0.08 0.14 0.18 0.22 0.26Step by Step Solution
There are 3 Steps involved in it
1 Expert Approved Answer
Step: 1 Unlock

Question Has Been Solved by an Expert!
Get step-by-step solutions from verified subject matter experts
Step: 2 Unlock
Step: 3 Unlock