

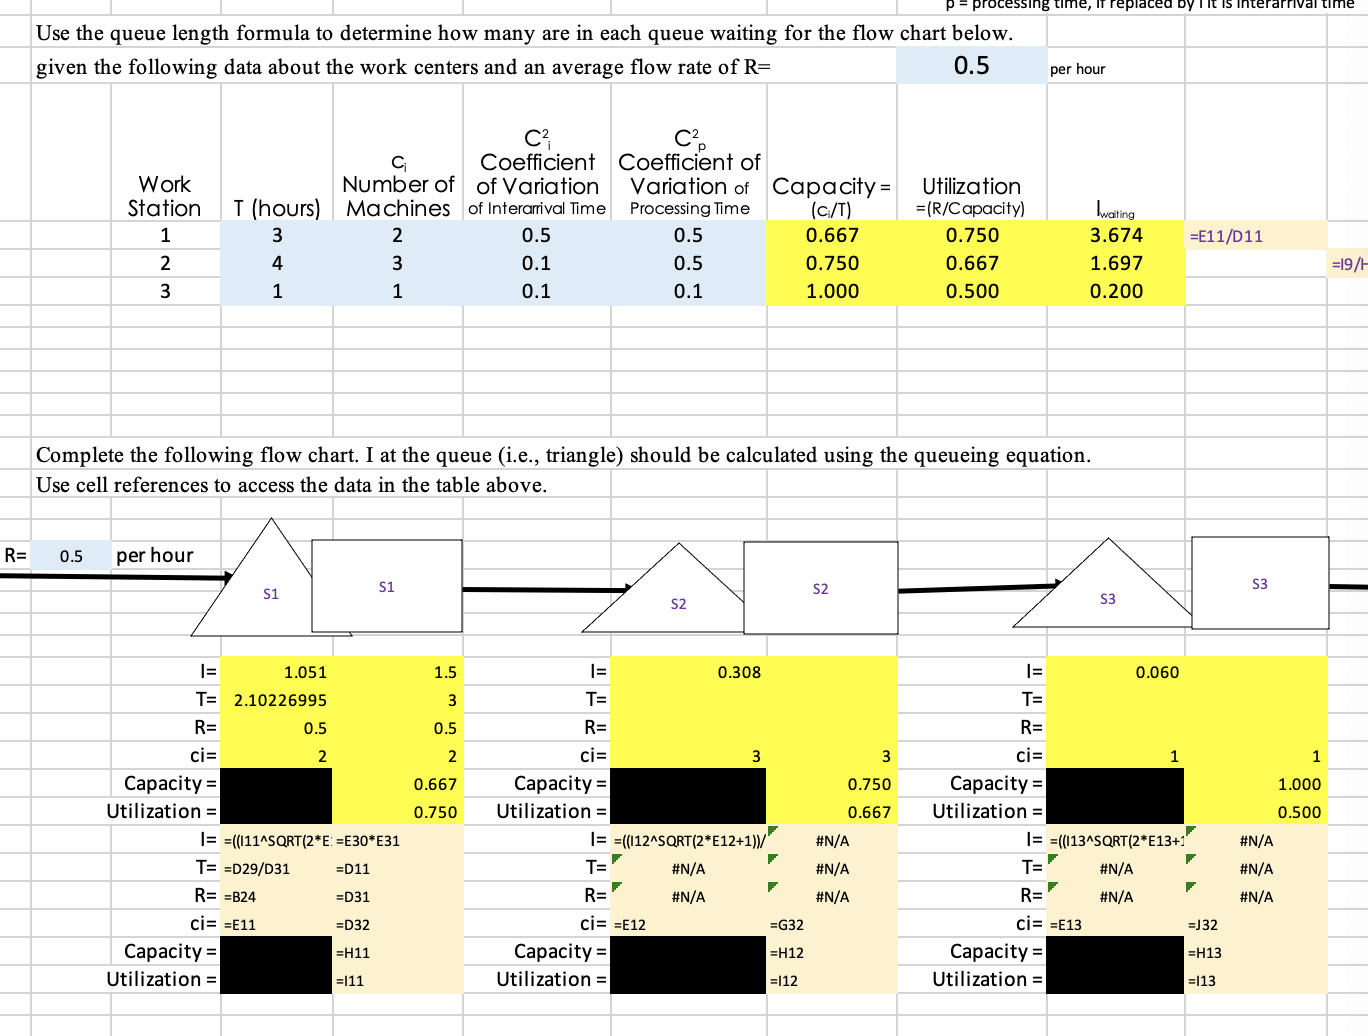
Question: using the above diagram, fill out the chart for question 2 and fill i n all the yellow boxes. All the current yellow boxes filled
using the above diagram, fill out the chart for question and fill all the yellow boxes. All the current yellow boxes filled are wrong. put formulas and show work get answer.
where utilization, number machines,
coefficient variation squared,
processing time, replaced interarrival time
Step by Step Solution
There are 3 Steps involved in it
1 Expert Approved Answer
Step: 1 Unlock

Question Has Been Solved by an Expert!
Get step-by-step solutions from verified subject matter experts
Step: 2 Unlock
Step: 3 Unlock