

Question: Using the Amazon Financial Analysis (FY 2013 FY 2010) and Key Ratio Comparison, calculate the missing values. (Enter your answers in thousands of dollars. Round
Using the Amazon Financial Analysis (FY 2013 FY 2010) and Key Ratio Comparison, calculate the missing values. (Enter your answers in thousands of dollars. Round your answers to 2 decimal place. Omit the "$" & "%" signs in your response.)
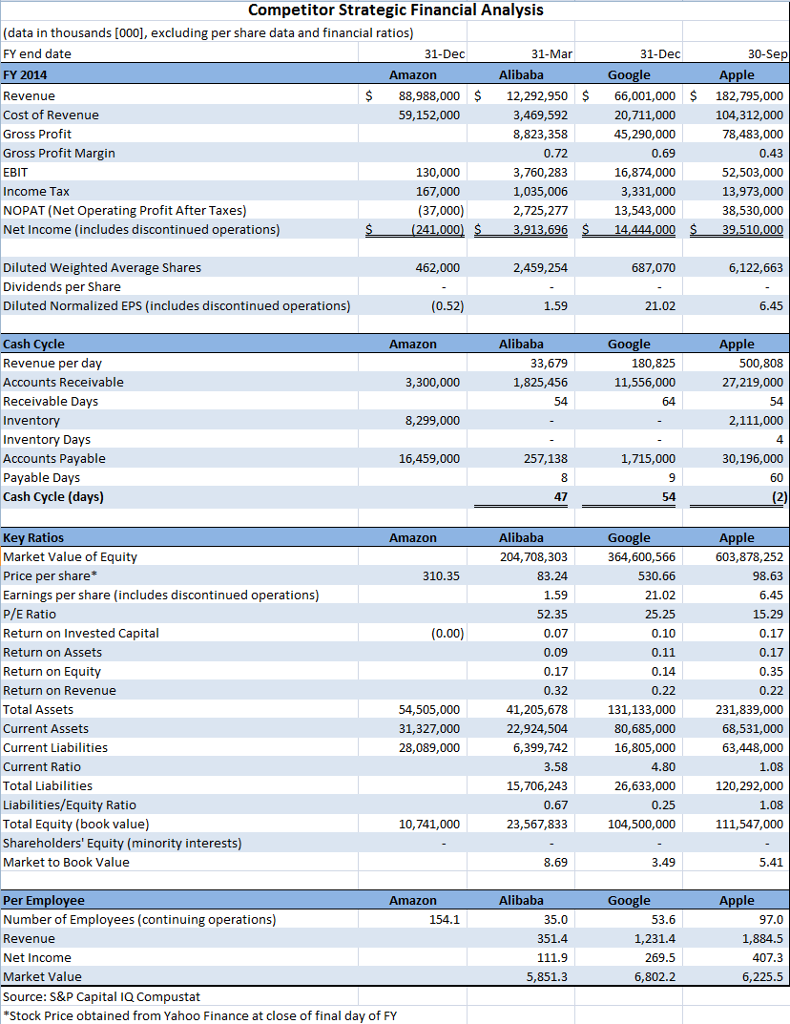
| Amazon Financial Analysis | ||
| (data in thousands [000s], excluding per share data and financial ratios) | ||
| FY end date | 31-Dec | |
| FY 2014 | ||
| Revenue | $ | 88,988,000 |
| Cost of Revenue | 59,152,000 | |
| Gross Profit | ||
| Gross Profit Margin | ||
| EBIT | 130,000 | |
| Income Tax | 167,000 | |
| NOPAT (Net Operating Profit After Taxes) | 37,000 | |
| Net Income (includes discontinued operations) | $ | (241,000) |
| Diluted Weighted Average Shares | 462,000 | |
| Dividends per Share | - | |
| Diluted Normalized EPS (includes discontinued operations) | (0.52) | |
| Cash Cycle | FY 2014 | |
| Revenue per day | ||
| Accounts Receivable | 3,300,000 | |
| Receivable Days | ||
| Inventory | 8,299,000 | |
| Inventory Days | ||
| Accounts Payable | 16,459,000 | |
| Payable Days | ||
| Cash Cycle (days) | () | |
| Key Ratios | FY 2014 | |
| Market Value of Book Equity | ||
| Price per share* | 310.35 | |
| Earnings per share (includes discontinued operations) | () | |
| P/E Ratio | () | |
| Return on Invested Capital | 0.00 | |
| Return on Assets | () | |
| Return on Equity | () | |
| Return on Revenue | () | |
| Total Assets | 54,505,000 | |
| Current Assets | 31,327,000 | |
| Current Liabilities | 28,089,000 | |
| Current Ratio | ||
| Total Liabilities | ||
| Liabilities/Equity Ratio | ||
| Total Equity (book value) | 10,741,000 | |
| Shareholders' Equity (minority interests) | - | |
| Market to Book Value | ||
| Per Employee | FY 2014 | |
| Number of Employees (continuing operations) | 154.1 | |
| Revenue | ||
| Net Income | () | |
| Market Value | ||
  I Iam reposting this Question because the answer was not entirely right. I left the correct answers I need the wrong answers answered and please show work. I Iam reposting this Question because the answer was not entirely right. I left the correct answers I need the wrong answers answered and please show work. | ||
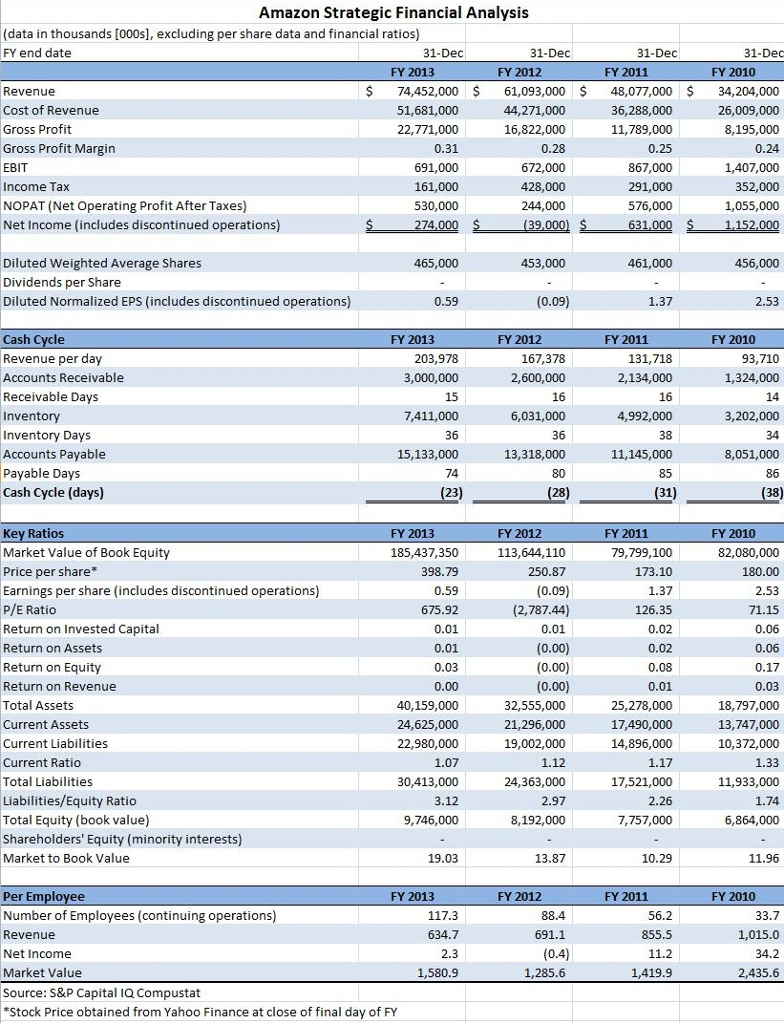
Amazon Strategic Financial Analysis (data in thousands [000s], excluding per share data and financial ratios) FY end date Dec FY 2013 FY 2011 FY 2010 Revenue Cost of Revenue Gross Profit Gross Profit Margin 74,452,000 61,093,000 48,077,00034,204,000 26,009,000 8,195,000 44,271,000 16,822,000 51,681,000 36,288,000 11,789,000 691,000 867,000 1,407,000 Income Tax NOPAT (Net Operating Profit After Taxes) Net Income (includes discontinued operations) 530,000 Diluted Weighted Average Shares Dividends per Share Diluted Normalized EPS (includes discontinued operations) FY 2013 FY 2012 FY 2011 FY 2010 167,378 Revenue per day Accounts Receivable Receivable Days 131,718 2,134,000 93,710 1,324,000 15 7,411,000 36 15,133,000 3,202,000 34 6,031,000 4,992,000 Inventory Days Accounts Payable 13,318,000 80 28 11,145,000 85 86 38 Cash Cycle (days) FY 2013 185,437,350 FY 2012 113,644,110 FY 2011 FY 2010 Market Value of Book Equity Price per share* Earnings per share (includes discontinued operations) P/E Ratio Return on Invested Capital Return on Assets Return on Equity Return on Revenue Total Assets Current Assets Current Liabilities Current Ratio Total Liabilities Liabilities/Equity Ratio Total Equity (book value) Shareholders' Equity (minority interests) Market to Book Value 79,799,100 (2,787.44) 25,278,000 17,490,000 14,896,000 0.03 18,797,000 13,747,000 10,372,000 24,625,000 22,980,000 19,002,000 24,363,000 8,192,000 30,413,000 17,521,000 11,933,000 9,746,000 7,757,000 FY 2013 FY 2012 FY 2011 FY 2010 Number of Employees (continuing operations) Revenue Net Income Market Value Source:S&P Capital IQ Compustat 691.1 855.5 1,285.6 2,435.6 Stock Price obtained from Yahoo Finance at close of final day of FY Amazon Strategic Financial Analysis (data in thousands [000s], excluding per share data and financial ratios) FY end date Dec FY 2013 FY 2011 FY 2010 Revenue Cost of Revenue Gross Profit Gross Profit Margin 74,452,000 61,093,000 48,077,00034,204,000 26,009,000 8,195,000 44,271,000 16,822,000 51,681,000 36,288,000 11,789,000 691,000 867,000 1,407,000 Income Tax NOPAT (Net Operating Profit After Taxes) Net Income (includes discontinued operations) 530,000 Diluted Weighted Average Shares Dividends per Share Diluted Normalized EPS (includes discontinued operations) FY 2013 FY 2012 FY 2011 FY 2010 167,378 Revenue per day Accounts Receivable Receivable Days 131,718 2,134,000 93,710 1,324,000 15 7,411,000 36 15,133,000 3,202,000 34 6,031,000 4,992,000 Inventory Days Accounts Payable 13,318,000 80 28 11,145,000 85 86 38 Cash Cycle (days) FY 2013 185,437,350 FY 2012 113,644,110 FY 2011 FY 2010 Market Value of Book Equity Price per share* Earnings per share (includes discontinued operations) P/E Ratio Return on Invested Capital Return on Assets Return on Equity Return on Revenue Total Assets Current Assets Current Liabilities Current Ratio Total Liabilities Liabilities/Equity Ratio Total Equity (book value) Shareholders' Equity (minority interests) Market to Book Value 79,799,100 (2,787.44) 25,278,000 17,490,000 14,896,000 0.03 18,797,000 13,747,000 10,372,000 24,625,000 22,980,000 19,002,000 24,363,000 8,192,000 30,413,000 17,521,000 11,933,000 9,746,000 7,757,000 FY 2013 FY 2012 FY 2011 FY 2010 Number of Employees (continuing operations) Revenue Net Income Market Value Source:S&P Capital IQ Compustat 691.1 855.5 1,285.6 2,435.6 Stock Price obtained from Yahoo Finance at close of final day of FY
Step by Step Solution
There are 3 Steps involved in it

Get step-by-step solutions from verified subject matter experts