

Question: Using the attached data, calculate the upper control limit for the R chart. A. 1.201 B. 1.251 C. 1.006 D. 1.457 E. 1.985 F. 1.992
Using the attached data, calculate the upper control limit for the R chart. A. 1.201 B. 1.251 C. 1.006 D. 1.457 E. 1.985 F. 1.992
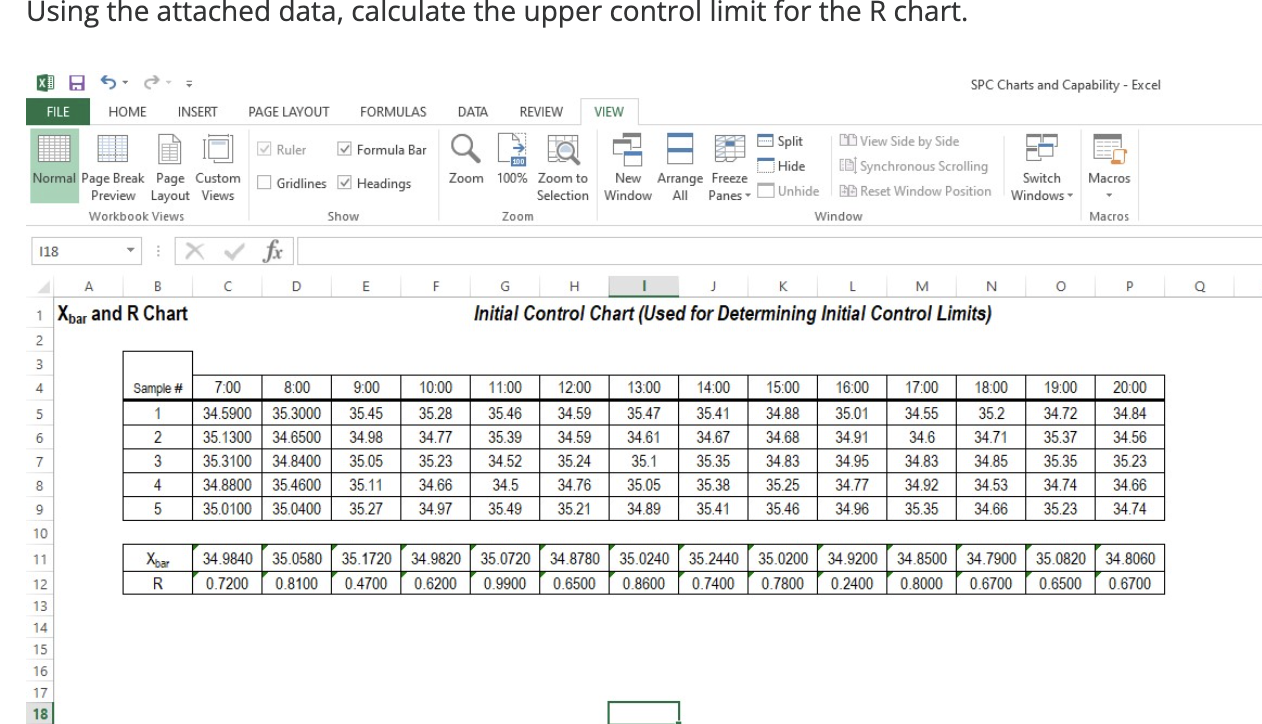
Using the attached data, calculate the upper control limit for the R chart. SPC Charts and Capability - Excel \begin{tabular}{|c|c|c|c|c|c|c|c|c|c|c|c|c|c|c|c|c|} \hline Xbar & 34.9840 & 35.0580 & 35.1720 & 34.9820 & 35.0720 & 34.8780 & 35.0240 & 35.2440 & 35.0200 & 34.9200 & 34.8500 & 34.7900 & 35.0820 & 34.8060 \\ \hline R & 0.7200 & 0.8100 & 0.4700 & 0.6200 & 0.9900 & 0.6500 & 0.8600 & 0.7400 & 0.7800 & 0.2400 & 0.8000 & 0.6700 & 0.6500 & 0.6700 \\ \hline \end{tabular}
Step by Step Solution
There are 3 Steps involved in it
1 Expert Approved Answer
Step: 1 Unlock

Question Has Been Solved by an Expert!
Get step-by-step solutions from verified subject matter experts
Step: 2 Unlock
Step: 3 Unlock