

Question: Using the Black-Scholes pricing function in Excel, calculate how sensitive IBMs March 110 call price is to changes in stock price. How much does the
Using the Black-Scholes pricing function in Excel, calculate how sensitive IBMs March 110 call price is to changes in stock price. How much does the call price vary for $0.50 changes in IBM share price when the option is at the money (assume stock price=$110), in the money (assume stock price=$115), and out of the money (assume stock price=$105)? What does this sensitivity analysis tell you?
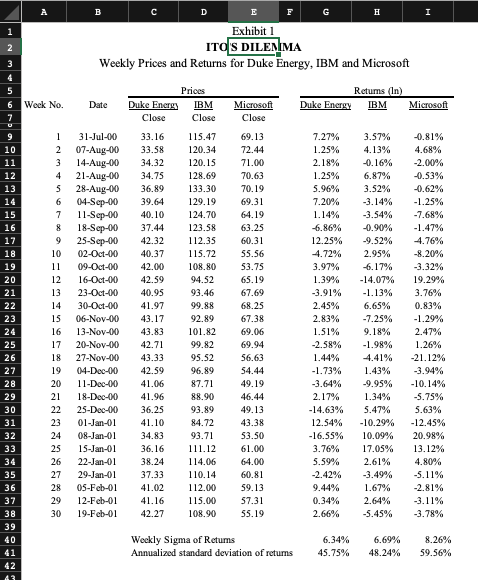
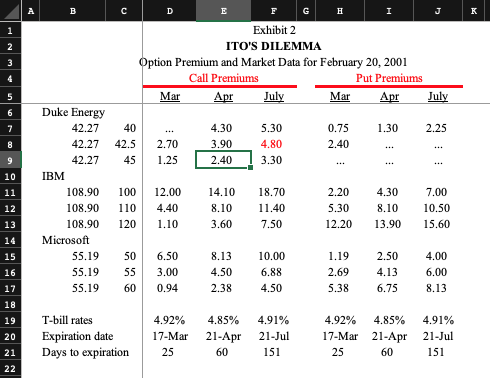
Exhibit 1 ITOS DILENIMA Weekly Prices and Returns for Duke Energy, IBM and Microsoft Returns (In) Duke Energy IBM Microsoft 20 -0.81% 4.68% -2.00% -0.53% Prices 6 Week No. Date Duke Energy IBM Microsoft Close Close Close 1 31-Jul-00 3 3.16 115.47 69.13 2 07-Aug-00 33.58 120.34 72.44 3 14-Aug-00 34.32 120.15 71.00 4 21-Aug-003 4.75 128.69 70.63 5 28-Aug-00 36.89 133.30 70.19 6 04-Sep-00 39.64 129.19 69.31 7 11-Sep-00 40.10 124.70 64.19 18-Sep-00 37.44 123.58 63.25 9 25-Sep-00 42.32 112.35 60.31 10 02-Oct-00 40.37 115.72 55.56 1109-Oct-00 42.00 108.80 53.75 12 16-Oct-00 42.59 94.52 65.19 13 23-Oct-00 40.95 93.46 67.69 14 30-Oct-00 41.97 99.88 68.25 15 06-Nov-00 43.17 92.89 67.38 16 13-Nov-00 4 3.83 101.82 69.06 17 20-Nov-00 42.71 99.82 69.94 18 27-Nov-00 43.33 95.52 56.63 1904-Dec-00 42.59 96.89 54.44 2011-Dec-0041.06 87.7149.19 21 18-Dec-00 41.96 88.90 46.44 25-Dec-00 36.25 93.89 49.13 01-Jan-01 41.10 84.72 43.38 08-Jan-01 3 4.83 93.71 53.50 25 15-Jan-01 36.16 1 11.12 61.00 26 22-Jan-01 3 8.24 114.06 64.00 27 29-Jan-01 37.33 110.14 60.81 28 05-Feb-01 41.02 112.00 59.13 12-Feb-01 41.16 115.00 57.31 30 19-Feb-01 4 2.27 108.90 55.19 7.27% 1.25% 2.18% 1.25% 5.96% 7.20% 1.14% 6.86% 12.25% 4.72% 3.97% 1.39% -3.91% 2.45% 2.83% 1.51% -2.58% 1.44% -1.73% -3.64% 2.17% -14.63% 12.54% -16.55% 3.76% 5.59% -2.42% 9.44% 0.34% 2.66% 3.57% 4.139 -0.16% 6.87% 3.52% -3.14% -3.54% -0.90% -9.52% 2.95% 6.17% -14.07% -1.13% 6.65% -7.25% 9.18% -1.98% 4.41% 1.43% -9.95% 1.34% 5.47% -10.29% 10.09% 17.05% 2.61% -3.49% 1.67% 2.64% -5.45% -1.25% -7.68% -1.47% 4.76% -8.20% -3.32% 19.29% 3.76% 0.83% -1.29% 2.47% 1.26% -21.12% -3.94% -10.14% -5.75% 5.63% -12.45% 20.98% 13.12% 4.80% -5.11% 2.81% -3.11% -3.78% 22 Weekly Sigma of Returns Annualized standard deviation of returns 6.34% 45.75% 6.69% 48.24% 8.26% 59.56% C D E Exhibit 2 ITO'S DILEMMA Option Premium and Market Data for February 20, 2001 Call Premiums Put Premiums Mar Apr July Mar Apr July Duke Energy 1.30 2.25 ... 2.70 1.25 4.30 5.30 3.90 4.80 2.40 13.30 0.75 2.40 10 42.27 42.5 42.27 45 IBM 108.90 100 108.90 110 108.90 120 Microsoft 55.19 50 55.19 55 55.1960 12.00 4.40 1.10 14.10 8.10 3.60 18.70 11.40 7.50 2.20 5.30 12.20 4.30 8.10 13.90 7.00 10.50 15.60 6.50 3.00 0.94 8.13 4.50 2.38 10.00 6.88 4.50 1.19 2.69 5.38 2.50 4.00 4.136.00 6.75 8.13 T-bill rates Expiration date Days to expiration 4.92% 17-Mar 25 4.85% 21-Apr 60 4.91% 21-Jul 151 4.92% 17-Mar 4.85% 21-Apr 60 4.91% 21-Jul 151 25
Step by Step Solution
There are 3 Steps involved in it

Get step-by-step solutions from verified subject matter experts