

Question: using the chart at the bottom , what tests would you use for the following? Using the above chart, what tests would you use for
using the chart at the bottom
, what tests would you use for the following?
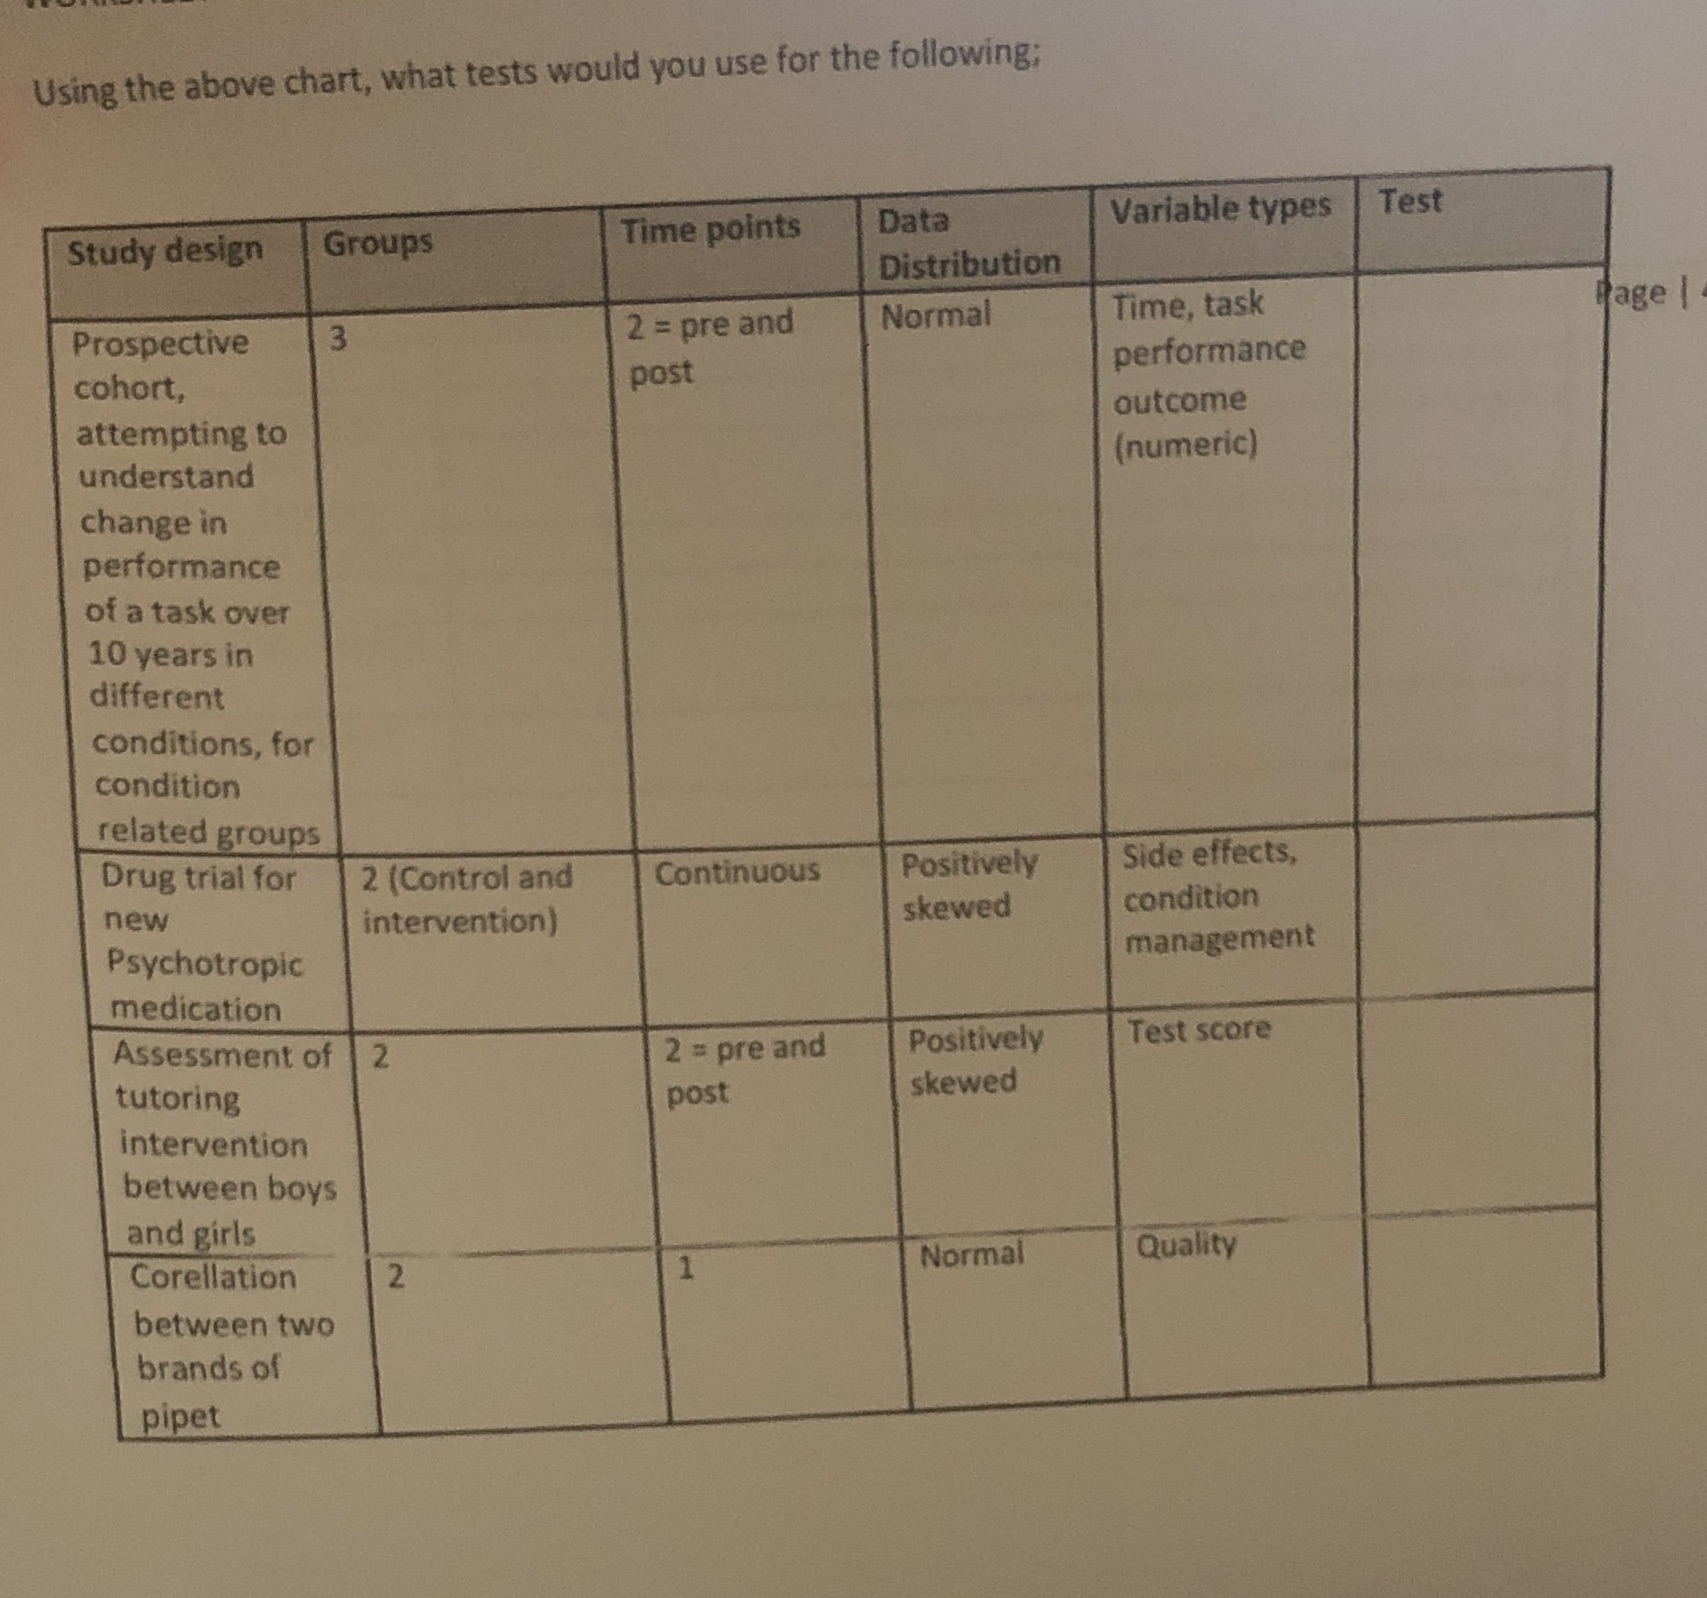

Using the above chart, what tests would you use for the following; Test Study design Groups Time points Data Variable types Distribution Prospective 3 2 = pre and Normal Time, task Page | performance cohort, post outcome attempting to understand (numeric) change in performance of a task over 10 years in different conditions, for condition related groups Drug trial for 2 (Control and Continuous Positively Side effects, new intervention) skewed condition Psychotropic management medication Assessment of 2 2 = pre and Positively Test score tutoring post skewed intervention between boys and girls Corellation 2 Normal Quality between two brands of pipetSection 2 - Choosing the test What are you Comparing within one group comparing? Comparing between two Page How many data collection time points do you have? 2 Retrospective Pre/Post-test 3 Pre-test, Post-test How many Pre-test, Test 1, Test 2, Post-test More than 25 observations do you have? Less than 25 Ordinal Nominal Binary What kind of data do Categorical you have? Continuous Interval Ratio What does your data Normal distribution look like? Non-normal Figure 1 - adapted from the University of Minnesota
Step by Step Solution
There are 3 Steps involved in it

Get step-by-step solutions from verified subject matter experts