

Question: Using the chart below, can you answer the following highlighted questions: K. Activity: Comparing Economic Systems The World Factbaak. put together by the United States

Using the chart below, can you answer the following highlighted questions:
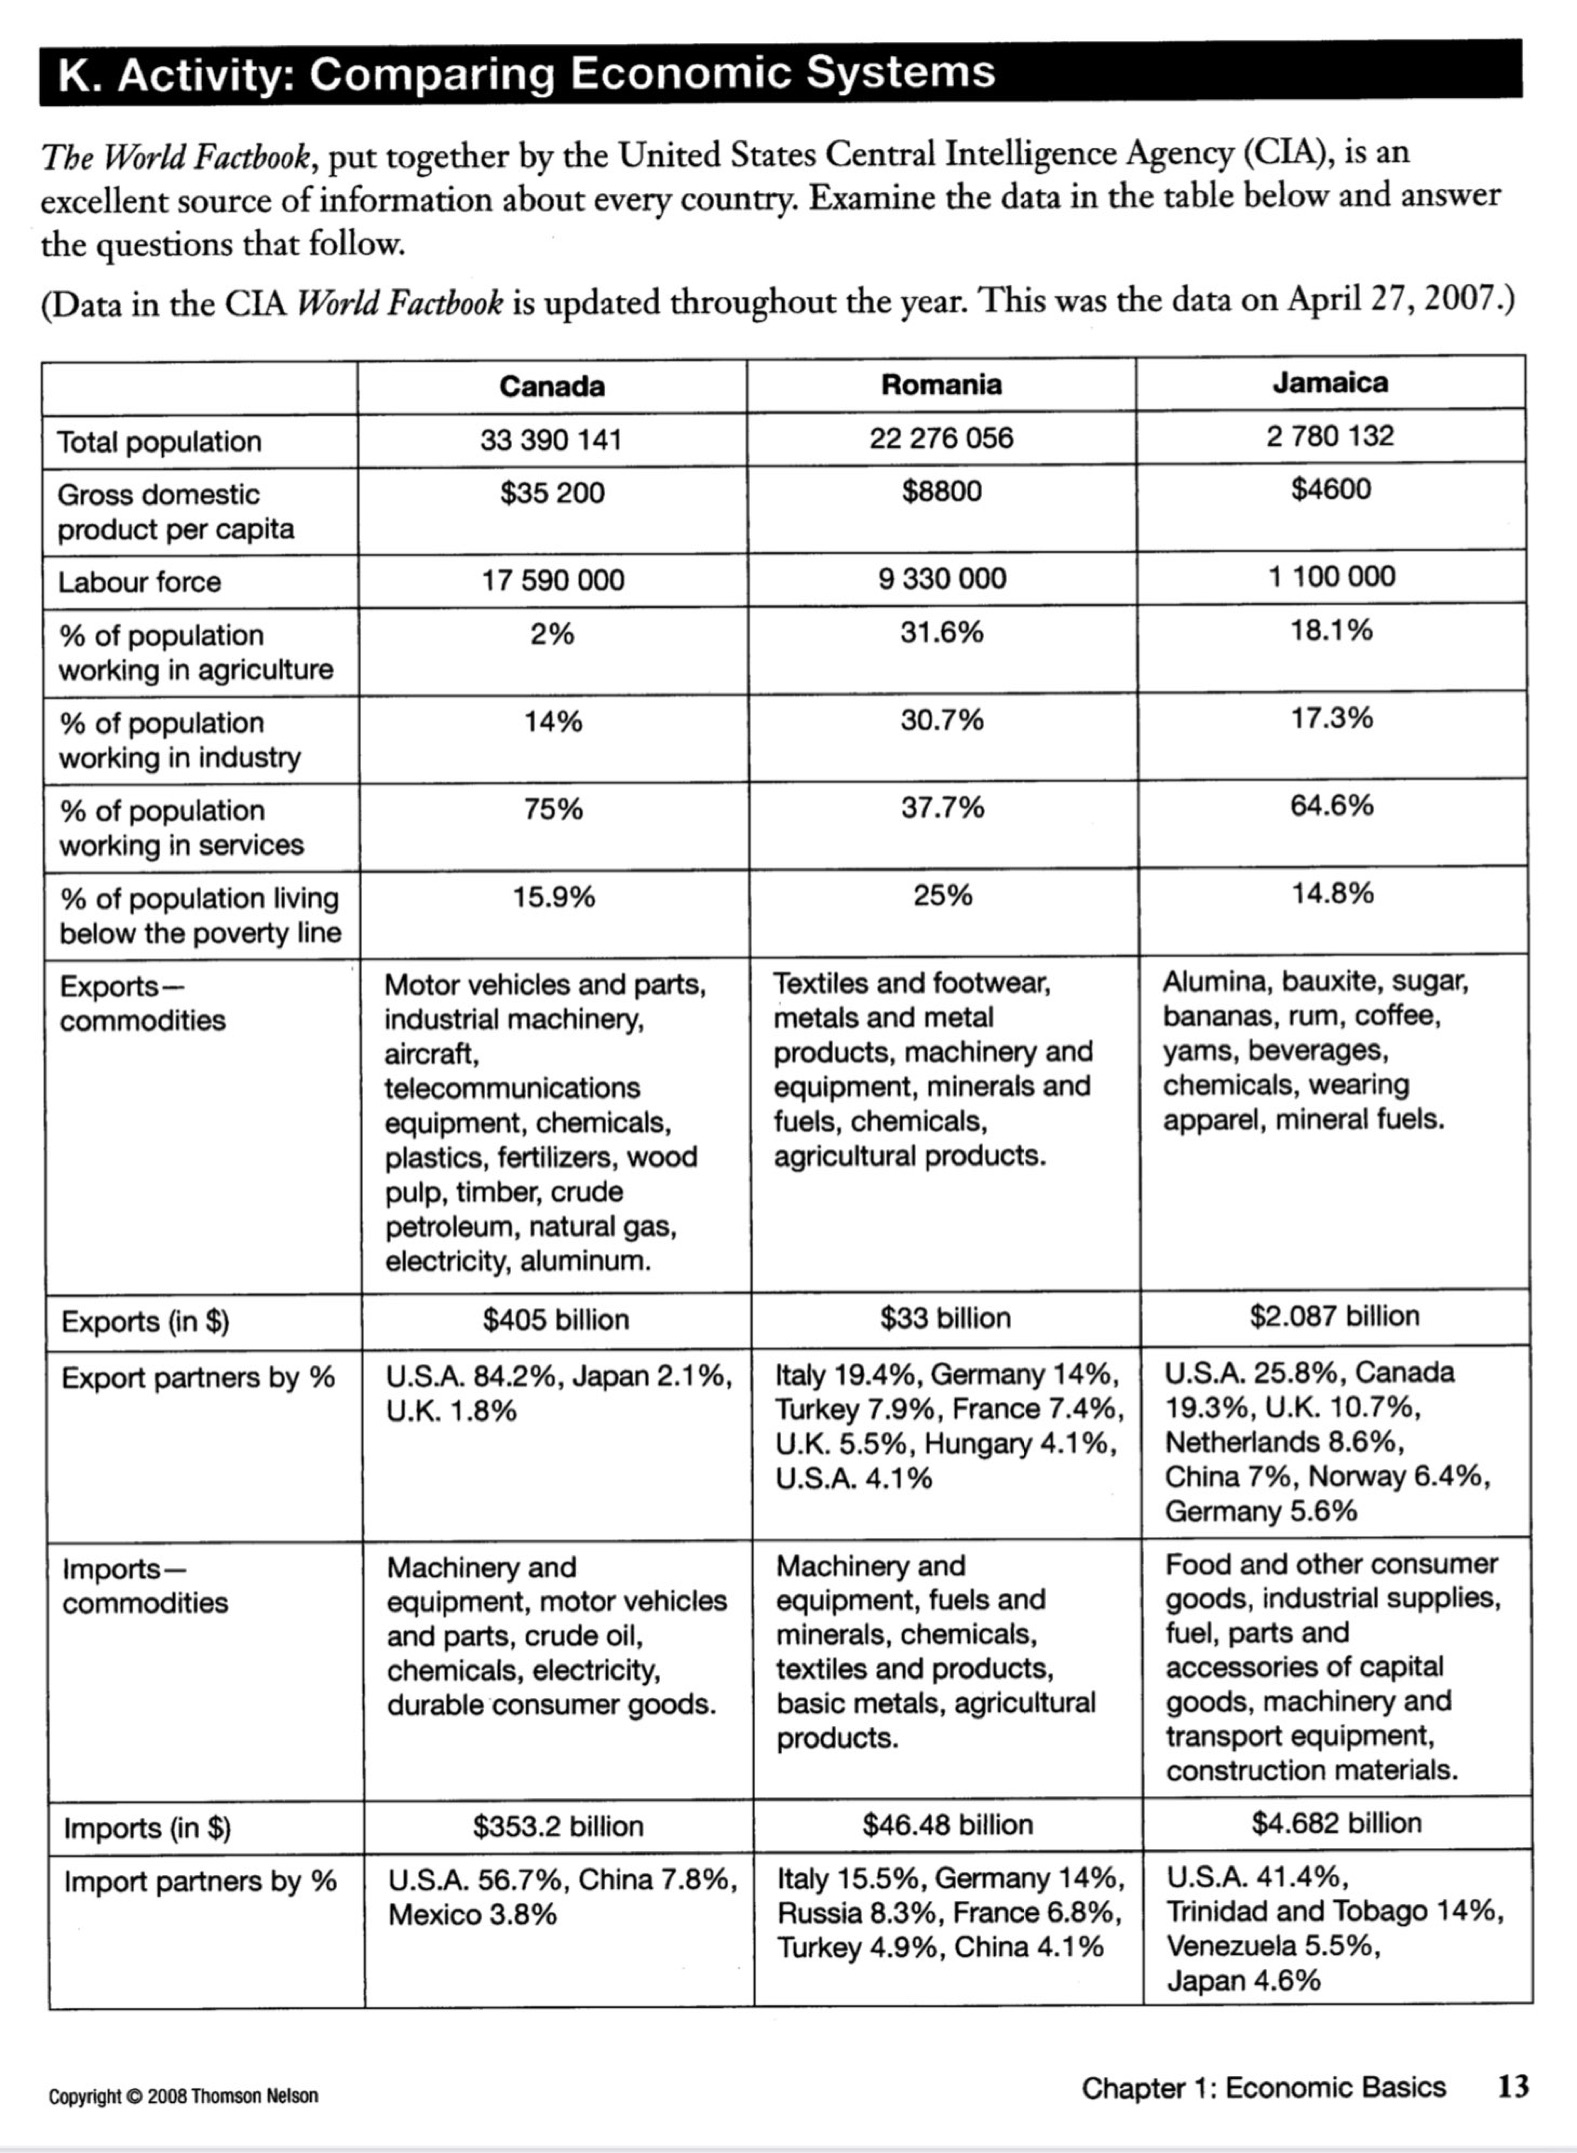

K. Activity: Comparing Economic Systems The World Factbaak. put together by the United States Central Intelligence Agency (CIA), is an excellent source of information about every country. Examine the data in the table below and answer the questions that follow. (Data in the CIA [World Factboole is updated throughout the year. This was the data on April 27. 2007.) % of population working in services % of population living below the poverty line Motor vehicles and parts. Textiles and footwear. Alumina. bauxite. sugar. industrial machinery. metals and metal bananas. rum. coffee, aircraft, products, machinery and yarns. beverages. telecommunications equipment, minerals and chemicals. wearing equipment. chemicals. fuels. chemicals, apparel, mineral fuels. plastics, fertilizers. wood agricultural products. pulp. timber. crude petroleum. natural gas. electricity. aluminum. mans) U.S.A. 84.2%. Japan 2.1 %. Italy 19.4%, Germany 14%. U.SA. 25.8%. Canada Turkey 7.9%. France 7.4%, 19.3%. U.K. 10.7%. U.K. 5.5%. Hungary 4.1%. Netherlands 8.6%, U.S.A. 4.1% China 7%. Nomay 6.4%. Germany 5.6% Imports Machinery and Machinery and Food and other consumer commodities equipment. motor vehicles equipment, fuels and goods. industrial supplies. and parts, crude oil, minerals. chemicals, fuel. parts and chemicals. electricity. textiles and products, accessories of capital durable consumer goods. basic metals. agricuitural goods. machinery and products. transport equipment, construction materials. Import partners by % U.S.A. 56.7%. China 7.8%. italy 15.5%. Germany 14%, U.S.A. 41.4%. Mexico 3.8% Russia 8.3%. France 6.8%. Trinidad and Tobago 14%. Turkey 4.9%. China 4.1% Venezuela 5.5%. Japan 4.6% woman-mm Chapter 1: Economic Basics 13 1. What percentage of the population of each country is in the labour force? 2. What are the similarities and differences between the three countries in terms of the percentage of the population that works in each type of industry? 3. Why might the list of Canadian exports be so much longer than that of Romania? 4. Why might some commodities appear on both a country's import and export list? Provide an example to explain your answer. 5. Exports and imports total in the billions of dollars for each country. Explain what this tells you about our society. 14 Chapter 1: Economic Basics Copyright @ 2008 Thomson Nelson
Step by Step Solution
There are 3 Steps involved in it

Get step-by-step solutions from verified subject matter experts