

Question: Using the chart below: Open Dec 2019 97.29 Mar 2020 198.12 Jun 2020 98.95 Sep 2020 98.87 High 97.445 99.395 |99.335 99.270 Low 96.430 98.070
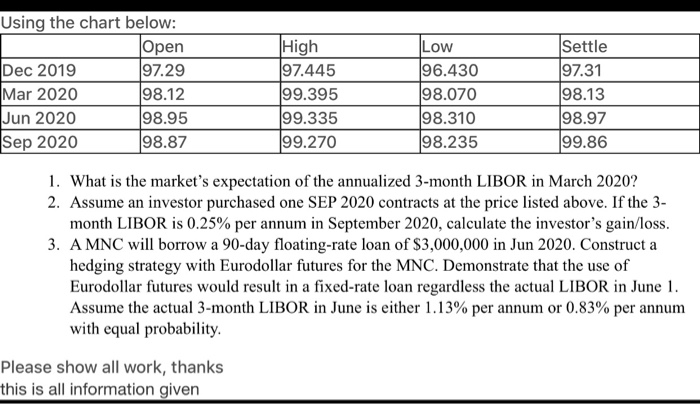
Using the chart below: Open Dec 2019 97.29 Mar 2020 198.12 Jun 2020 98.95 Sep 2020 98.87 High 97.445 99.395 |99.335 99.270 Low 96.430 98.070 |98.310 98.235 Settle 97.31 98.13 |98.97 99.86 1. What is the market's expectation of the annualized 3-month LIBOR in March 2020? 2. Assume an investor purchased one SEP 2020 contracts at the price listed above. If the 3- month LIBOR is 0.25% per annum in September 2020, calculate the investor's gain/loss. 3. A MNC will borrow a 90-day floating-rate loan of $3,000,000 in Jun 2020. Construct a hedging strategy with Eurodollar futures for the MNC. Demonstrate that the use of Eurodollar futures would result in a fixed-rate loan regardless the actual LIBOR in June 1. Assume the actual 3-month LIBOR in June is either 1.13% per annum or 0.83% per annum with equal probability. Please show all work, thanks this is all information given
Step by Step Solution
There are 3 Steps involved in it

Get step-by-step solutions from verified subject matter experts