

Question: Using the Data files of your textbook, extract the Excel data relating to 2500 managers of Electronic Associates (EAI) of Chapter 7. You can find
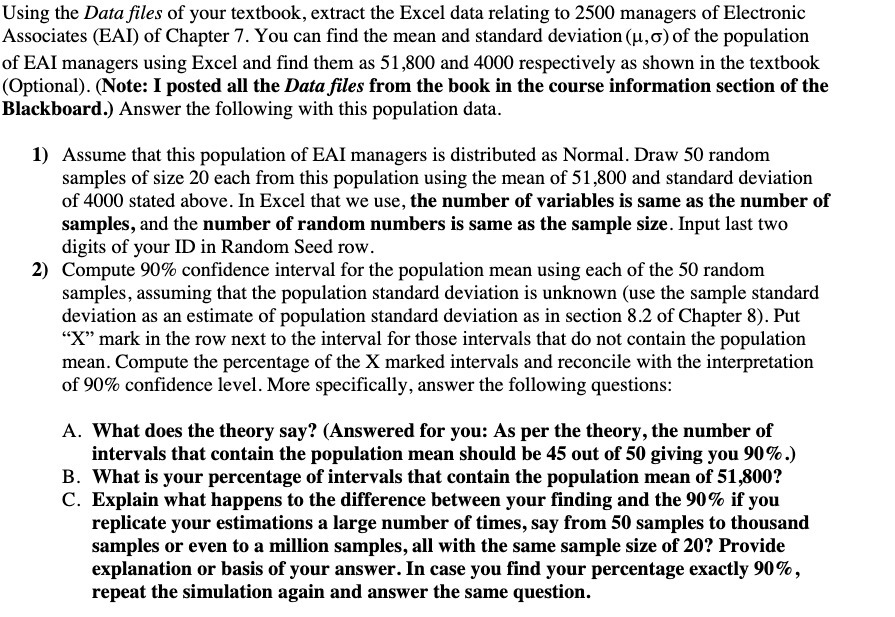

Using the Data files of your textbook, extract the Excel data relating to 2500 managers of Electronic Associates (EAI) of Chapter 7. You can find the mean and standard deviation (u, o) of the population of EAI managers using Excel and find them as 51,800 and 4000 respectively as shown in the textbook (Optional). (Note: I posted all the Data files from the book in the course information section of the Blackboard.) Answer the following with this population data. 1) Assume that this population of EAI managers is distributed as Normal. Draw 50 random samples of size 20 each from this population using the mean of 51,800 and standard deviation of 4000 stated above. In Excel that we use, the number of variables is same as the number of samples, and the number of random numbers is same as the sample size. Input last two digits of your ID in Random Seed row. 2) Compute 90% confidence interval for the population mean using each of the 50 random samples, assuming that the population standard deviation is unknown (use the sample standard deviation as an estimate of population standard deviation as in section 8.2 of Chapter 8). Put "X" mark in the row next to the interval for those intervals that do not contain the population mean. Compute the percentage of the X marked intervals and reconcile with the interpretation of 90% confidence level. More specifically, answer the following questions: A. What does the theory say? (Answered for you: As per the theory, the number of intervals that contain the population mean should be 45 out of 50 giving you 90%.) B. What is your percentage of intervals that contain the population mean of 51,800? C. Explain what happens to the difference between your finding and the 90% if you replicate your estimations a large number of times, say from 50 samples to thousand samples or even to a million samples, all with the same sample size of 20? Provide explanation or basis of your answer. In case you find your percentage exactly 90%, repeat the simulation again and answer the same
Step by Step Solution
There are 3 Steps involved in it

Get step-by-step solutions from verified subject matter experts